
Figure 14.
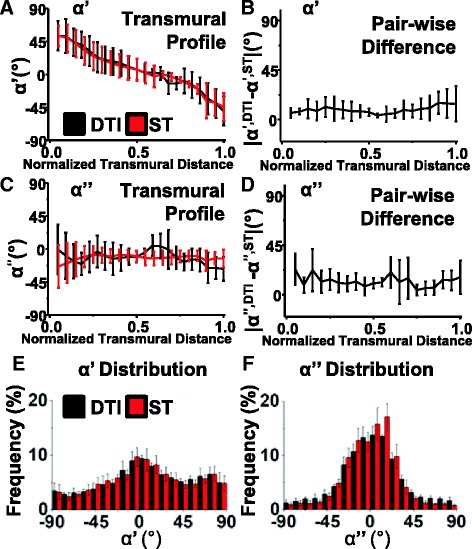
Quantitative comparison of ST and DTI putative myocyte angles of the 5 rat hearts. A - The transmural profiles of the putative myocyte helix angle (α’). B - The transmural pair-wise difference plots for the putative myocyte helix angle |α’e 1 DTI - α’v 1 ST|. C - The transmural profiles for the putative myocyte transverse angle (α”). D - The transmural pair-wise difference plots for the putative myocyte transverse angle |α”e 1 DTI – α”v 1 ST|. E - The distribution of the putative myocyte helix angles (α’). F - The distribution of the putative myocyte transverse angles (α”). DTI: Scan #1, 6-direction, b = 1000 s/mm2; ST: Scan #8, DTW = 3, STW = 3. FLASH: fast low angle shot; ST: structure tensor of FLASH data; DTI: diffusion tensor magnetic resonance imaging; DTW: derivative template width STW: smoothing template width. The symbols for vectors and derived angles are defined in Table 2.