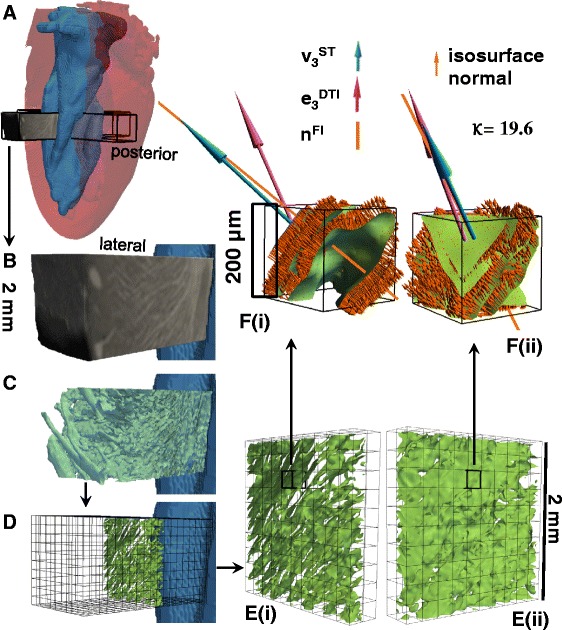
Figure 3.

Interactive segmentation of laminar architecture applied to all 200 μm cubes in the four ROIs to assess ST and DTI performance against the FLASH image from visualization based direct measurement. A – the location of the ROI is shown in the transparent whole heart volume seen from the posterio-lateral view. B – the cropped unprocessed FLASH image of the lateral ROI from the same posterio-lateral view; C – a contour (the green isosurface) was generated in the lateral ROI of the raw CMR image at a specified intensity threshold value (after upsampling/interpolating), the contour delineates the boundary between myolaminae and sheetlet interstices (except in the sub-epicardium, where laminae are absent) – the contour is shown within the CMR raw image; D - the contour has been divided into cubes of 200 × 200 x 200 μm3, and each cube corresponds to one DTI or ST voxel (the grid of these cubes is shown for the whole lateral ROI from a posterio-lateral view); E – the DTI/ST voxel cubes are shown, from a posterio-lateral view in (i) and from an anterio-lateral view in (ii), for the single transmural distance; F – a magnified view is shown of the previously highlighted individual voxel from (E), and on the laminar contour the normal to the contour is shown by the multiple small orange arrows, with the mean FLASH laminar orientation in this 200 μm cube (FI, n FI) shown by the orange line, the ST normal vector (v 3 ST) in blue, and the DTI normal vector in purple (e 3 DTI). It can be seen that the highlighted voxel that v 3 ST is closer than e 3 DTI to n FI (7.8° between v 3 ST and n FI, 24.7° between e 3 DTI and n FI, K = 19.6). DTI: Scan #1, 6-direction, b = 1000 s/mm2; ST: Scan #8; DTW = 3, STW = 3. FLASH: fast low angle shot; ST: structure tensor of FLASH data; DTI: diffusion tensor magnetic resonance imaging; FI: FLASH isosurface data; DTW: derivative template width STW: smoothing template width. The symbols for vectors and derived angles are defined in Table 2.
