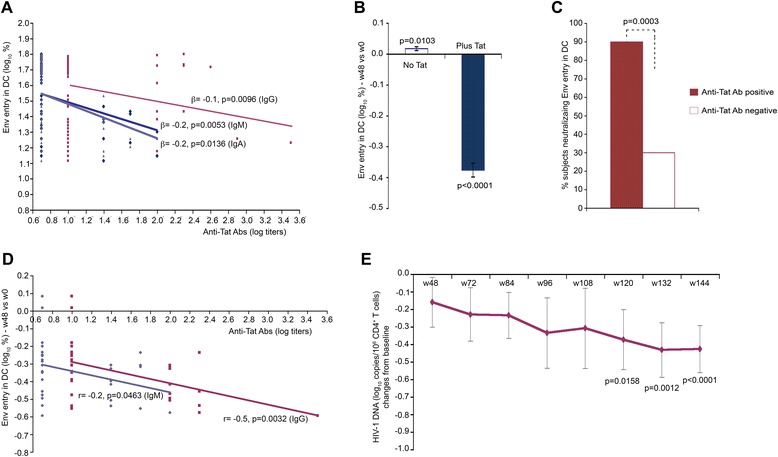
Figure 12.

Neutralization of Tat-mediated Env entry in DC and HIV-1 DNA in vaccinees. (A) Relationship between Tat-mediated entry of trimeric Env in DC and anti-Tat IgM (blue), IgG (red) and IgA (violet) Ab binding titers in subjects immunized with Tat 30 μg, 3x (generalized estimating equations with adjustment for repeated measures in the same patient; longitudinal samples from 31 individuals). (B) Percentage of Env entry in DC in the presence or absence of Tat in subjects immunized with Tat 30 μg, 3x at 48 weeks since the first immunization (n = 32) (Student’s t-test). Data are expressed as mean changes from baseline with standard error. (C) Inhibition of Tat-mediated Env entry in DC by anti-Tat Ab positive (n = 20) and anti-Tat Ab negative (n = 12) sera at week 48 from subjects immunized with Tat 30 μg, 3x. Of the 32 subjects evaluated, 30 were positive for anti-Tat Abs before week 48. Data are expressed as the percentage of subjects showing neutralization of Tat-mediated Env entry at 48 weeks as compared to baseline. (Fisher's Exact test) (D) Pearson correlation between anti-Tat IgM and IgG Ab titers at 48 weeks and Tat-mediated Env entry in DC at 48 weeks versus baseline in subjects immunized with Tat 30 μg, 3x (n = 32). (E) Reduction from baseline of HIV-1 DNA (log10 copies/106 CD4+ T cells) over time in sera from vaccinees (Tat 30 μg, 3x) positive for neutralization (≥50%) of Env entry in DC at week 48 since vaccination (n = 20). Data in panels are presented as mean values with standard error. Changes from baseline of HIV-1 DNA in subjects with anti-Tat Abs and neutralizing activity were evaluated with a longitudinal analysis for repeated measurements. P-values assess the values at each week after immunization versus values at baseline.
