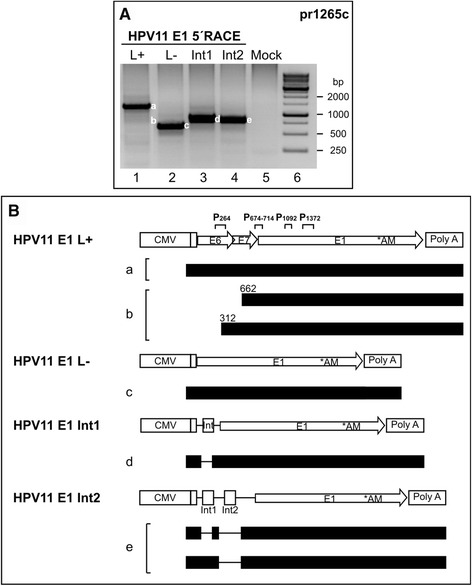
Figure 7.

Mapping of HPV11 promoter activity from E6/E7-containing E1 expression plasmids. (A) U2OS cells were transfected with 1 μg of different HPV11 expression plasmids (indicated at top of panel A and schematically introduced in panel B). PolyA+ mRNA was extracted at 24 h post-transfection, and 5′ RACE analysis was performed with the HPV11-specific primer pr1265c. The products from a-e were sequenced, and their structures are shown in panel B. Mock-transfected U2OS cells were used as a negative control (lane 5). (B) Schematic map of the 5′ RACE products from the E1 expression plasmids, together with HPV11 E1 L+, L-, Int1 and Int2 expression vector maps. All of the E1 protein-coding transcripts (indicated with letters from a-e, shown at left) are shown, indicating their exons (solid boxes), introns (lines) and potential TSSs in E6 and E7 ORFs (nt numbers).
