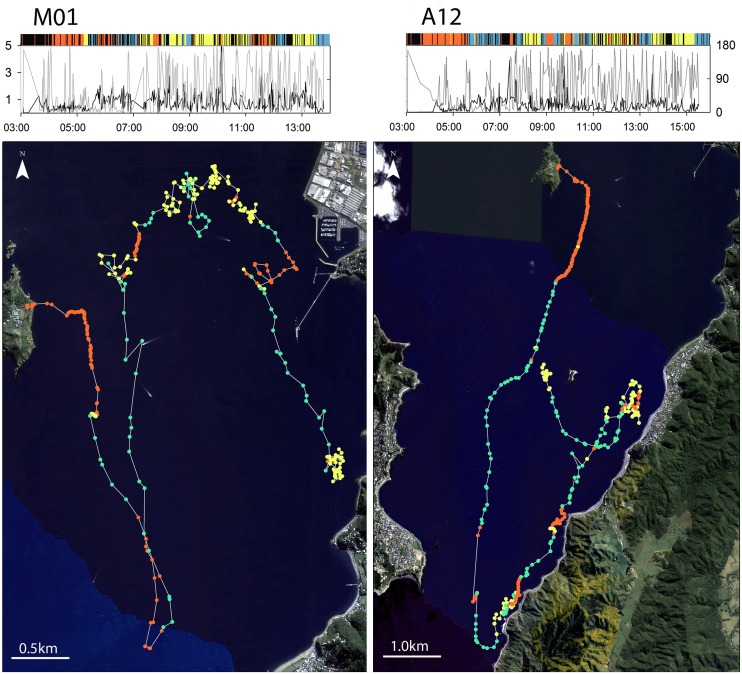
Fig 4. Examples of individual movement trajectories for which GPS-derived location estimates have been classified into discrete behavioural states, penguins A12 and M02.
Locations assigned as States 1, 2, and 3 are indicated by blue, red, and yellow points, respectively. Plots above the trajectories show observed inter-fix speeds (ms-1; black lines with axis values at the left side of M02 plot) and relative turning angles (degrees; grey lines with axis values at the right side of A12 plot) over time of day. Narrow bars above the plots denote the corresponding inferred states of behaviour.

