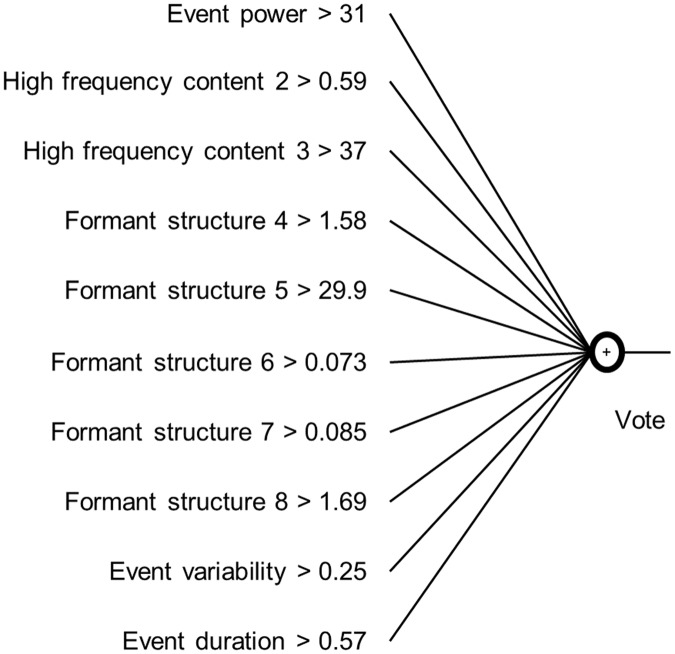
Fig 5. The resulting classification.
These were the found thresholds for each feature after applying the gini index to all sound events in the traing dataset. Each line resembles on feature with acompagning threshold. When an event’s feature value was above the threshold value, the sound event received one vote. All ten votes were subsequently summed together for one sound event.

