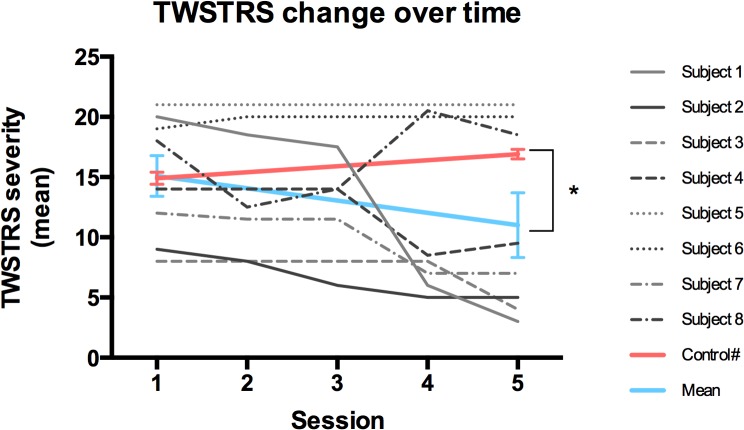
Fig 4. Change in TWSTRS severity score as a function of time shown from Session 1 to Session 5.
Individual subject data shown as well as study group mean data shown in blue line. Red line represents historical control data from Comella et al., 2011 [14] showing similar severity scores at Week 8 post-botulinum toxin injection (study Session 1). *p = 0.01.

