
Fig 1. Characterization of SLN and SLN-STAT3 decoy ODN complexes.
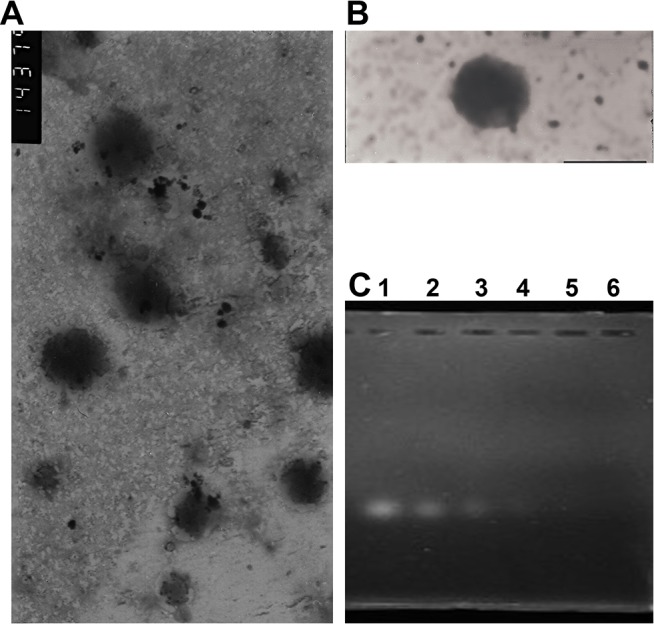
(A) TEM image of bare SLN (scale bar, 100 nm). (B) TEM image of SLN–STAT3 decoy ODN complexes (scale bar, 100 nm). (C) Gel retardation assay of SLN-decoy ODN complexes. A total of 0.5 μg of decoy ODN per hole was mixed with SLN. The weight ratios of SLN to ODN from left to right are as follows, lane 1: naked ODN control; lane 2: SLN:ODN = 5:1; lane 3: SLN:ODN = 10:1; lane 4: SLN:OND = 20:1; lane 5: SLN:ODN = 50:1; lane 6: SLN:ODN = 100:1.