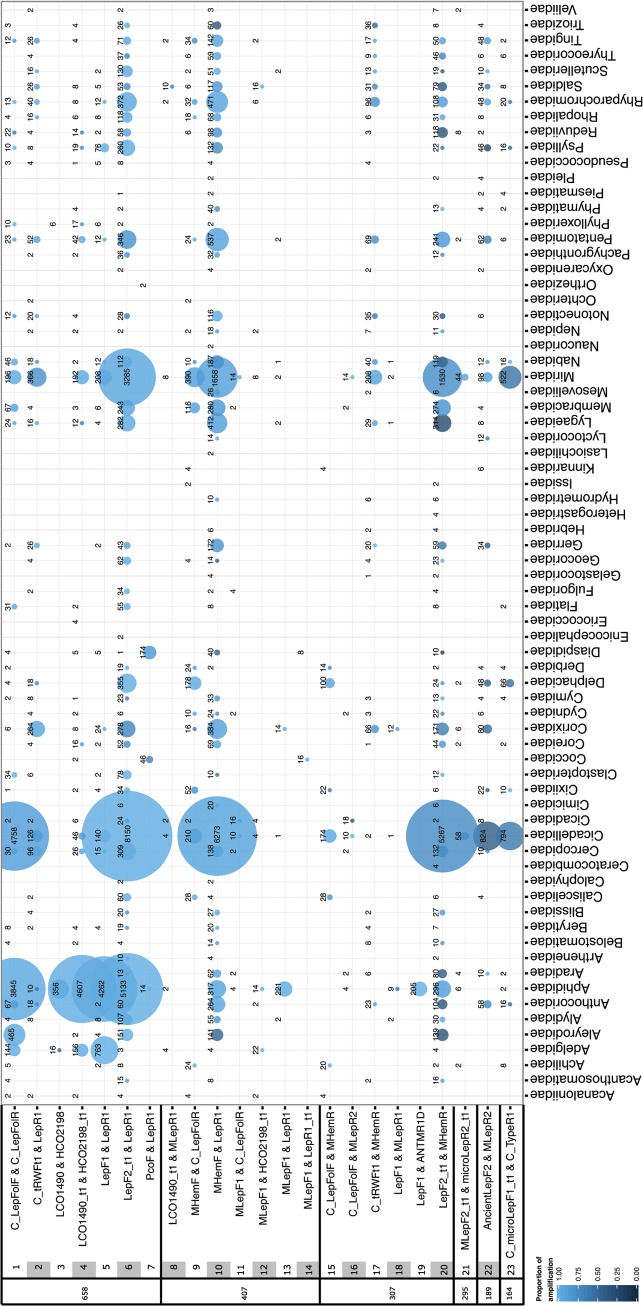
Fig 2. Proportions of PCR amplifications by taxon, generated with particular primer pairs, for all Hemiptera specimens in this study.
This heatmap pairs with Fig 1, where the sequentially shaded numbers in the left columns connect primer sequences and citations with their use, per hemipteran family. Primer pairs appear in descending order of amplicon lengths, at left. The dot area is proportional to all amplification attempts for that primer/family, the total number of specimens analyzed per primer combination is adjacent to each dot, and the shading indicates the proportion of successful amplifications (illustrated in the key at lower left). All cocktail primers are used in a 1:1 ratio.

