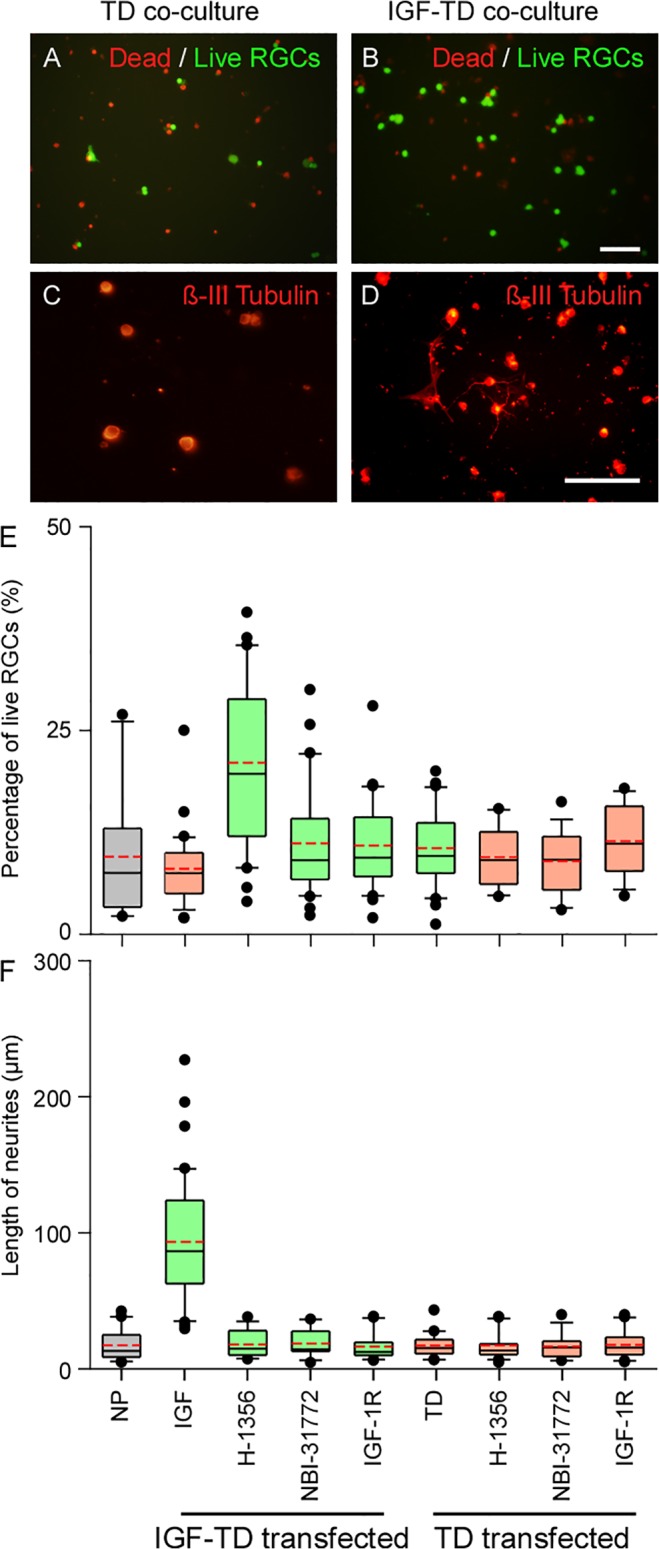
Fig 2. The survival rate and neurite outgrowth of primary RGCs co-cultured with transfected hNPs under various conditions.

Dead/live (green/red fluorescence) cell analysis of primary RGCs co-cultured with hNPTD (A) and hNPIGF-TD (B) cells shows increased live cells in the latter group. ß-III tubulin staining of co-cultured cells indicates that neurites were rarely observed in RGCs co-cultured with hNPTD cells (C) as compared with RGCs co-cultured with hNPIGF-TD cells (D) (Cy3, orange-red fluorescence). (E—F) Quantification of survival rate and neurite length in RGCs co-cultured with hNPIGF-TD or hNPTD cells in presence and absence of IGF antagonists Data was analyzed with Mann-Whitney U test. RGC survival rate was significantly higher in hNPIGF-TD co-cultures; IGF antagonists reduced both survival rate and neurite outgrowth of RGCs. The boxes in (E) and (F) represent the 0.25, median and 0.75 quantiles. On either side of the box, the whiskers extend to the minimum and maximum. Detailed index of each transfection is presented in the text. The red dash line in each box is the mean value. Abbreviations: NP, neuronal progenitor cells; TD, neuronal progenitor cells expressing TD (hNPTD); IGF-1, neuronal progenitor cells expressing IGF-TD fusion protein (hNPIGF-TD); Scale bar: 200 μm (A—B) and 50 μm (C—D).
