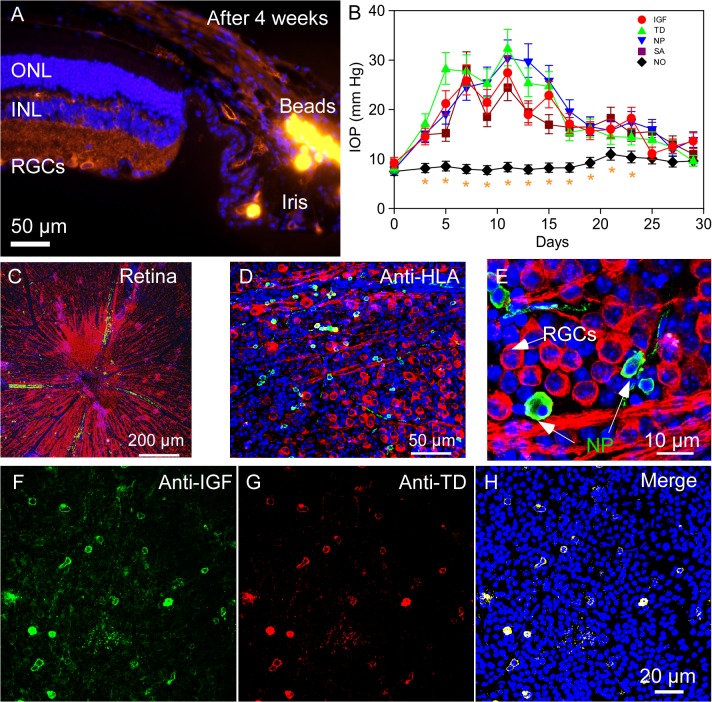
Fig 3. Microbead injection into the anterior chamber of C57BL/6 mice to induce elevation of IOP and glaucoma model.
(A) After 4 weeks, microbeads can be detected in the Schlemm’s canal (orange fluorescence on the right side of the photograph). (B) Fitted geometric mean IOP changes with the 95% confidence limits in all microbead injected and control groups. (group 1–5). Saline-injected group showed mean IOPs of ≤ 10 mmHg (group 1). Microbead injected eyes (group 2–5) showed rapid and steady rise in IOPs peaking between 5–12 days and sustained elevated IOPs during the one-month study period. Data were analyzed by fitting a mixed effects model to the logarithm of the data with two fixed effects (treatment and time) and the subject as a random intercept. Multiple comparisons were conducted using the Tukey test on the fitted data. Asterisks denote statistically significant differences versus all groups within the same time point. (C) Representative retinal wholemount after intravitreal hNP transplantation imaged on confocal microscopy. Red fluorescent structures (ß-III tubulin) represent host RGCs and their nerve fibers. (D) Green fluorescent dots (FITC, HLA Class I antigen expression) present hNPs that have penetrated the host retina. (E) High-resolution images of retinal flatmounts. (F, G) hNPs expressing IGF-TD can also be detected by their expression of IGF-1 (FITC-green) and TD (Rhodamine-red) components of the fusion protein. (H) Merged image of F and G. Abbreviations: ONL, outer nuclear layer; INL, inner nuclear layer; RGCs, retinal ganglion cells. IGF-TD, transplanted hNPIGF-TD cells after microbead injection; TD, transplanted hNPTD cells after microbead injection. hNP, untransfected hNPs after microbead injection; SA, intravitreal saline (no cells) injection after microbead injection; NO, intravitreal saline injection and saline injection into the anterior chamber (no microbead and cell injection).

