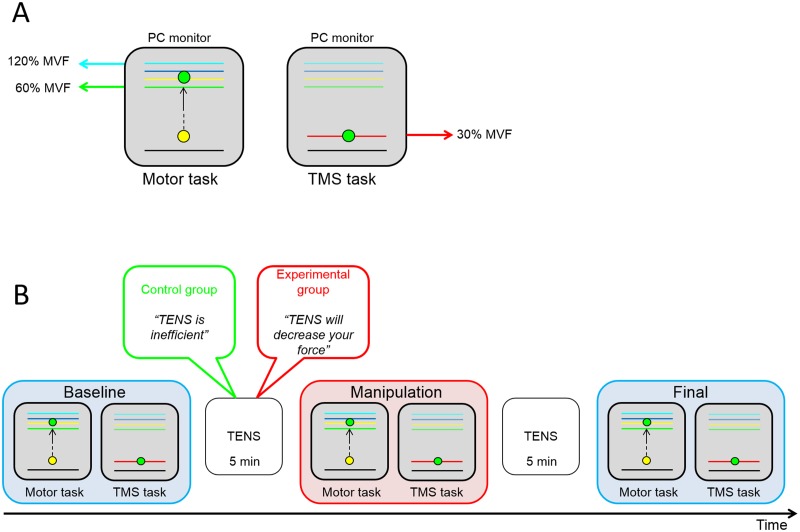
Fig 1. Schematic representation of the experimental set-up and protocol.
A) In the left panel, a representation of the motor task is shown. On the PC monitor there was a starting line (black line), a target zone (colored lines) and a cursor (yellow and green dot). The lowest line of the target zone (green) represented the 60% of the subject’s MVF, while the highest line (light blue) represented the 120% of MVF, as measured for each participant in the calibration phase at the very beginning of the experiment. The task was to press a piston with the right index finger as strong as possible in order to reach the higher lines of the target zone. The pressures against the piston were recorded by a force transducer and converted in vertical displacements of the cursor. When the cursor entered the target zone, it changed from yellow to green. In the right panel, a representation of the TMS task is shown. The red line represents the 30% of MVF as measured in the calibration phase. Subjects had to maintain the cursor on the red line until the end of the trial. B) Timeline of the experimental protocol with a representation of the sessions sequence (baseline, manipulation and final) and TENS application. As schematically shown in the picture, the two groups of participants (control and experimental) received different verbal information about the effects of TENS. Moreover, in the manipulation session the two groups underwent different procedures: the experimental group performed the motor task with a surreptitious reduction of the cursor’s excursion range (conditioning procedure), while the control group performed the motor task without any reduction.

