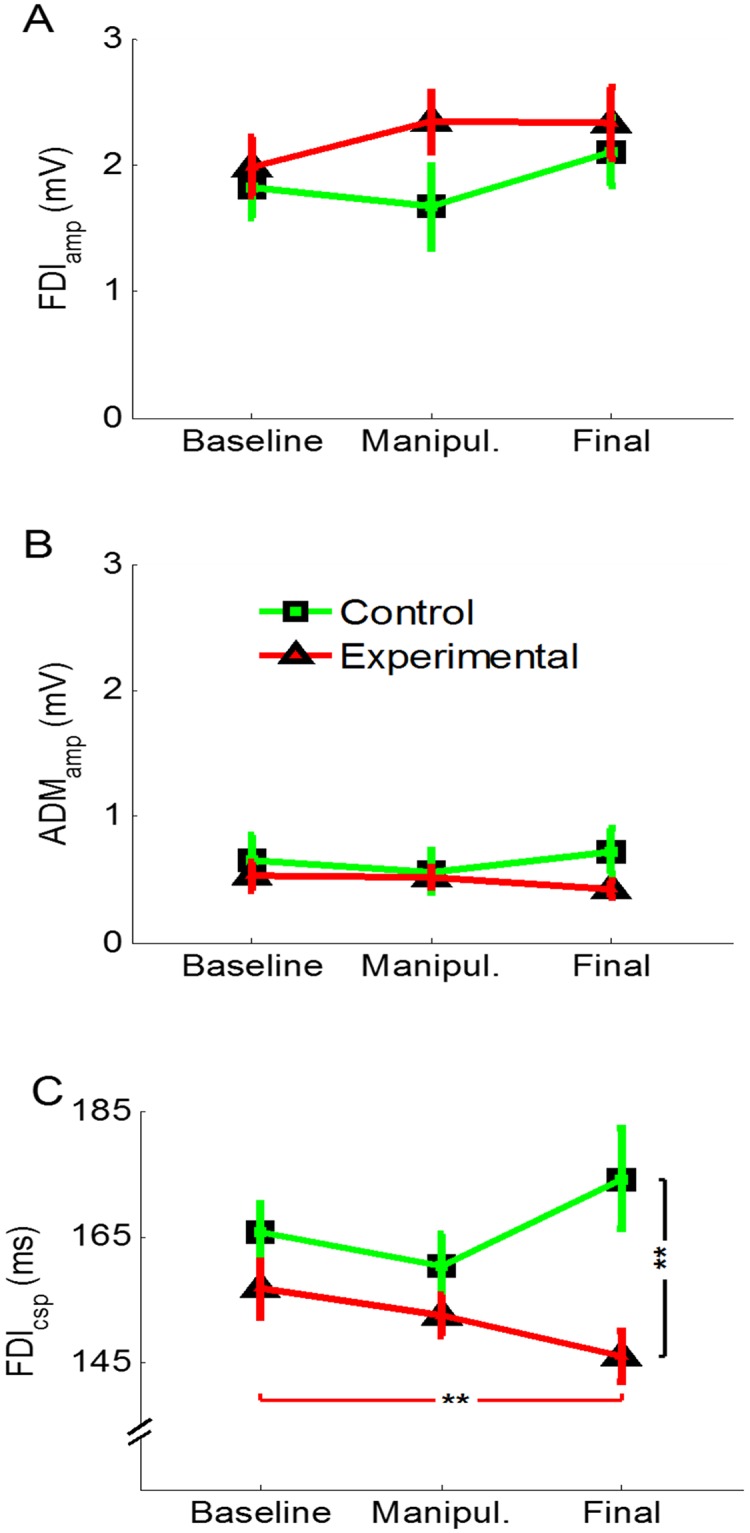
Fig 3. Neurophysiological data.

A) MEP amplitude recorded from the FDI muscle was comparable in the experimental (red line) and the control (green line) and across sessions. B) MEP amplitude recorded from the ADM muscle was comparable in the experimental (red line) and the control (green line) and across sessions. C) Duration of the CSP was shorter in the final than in the baseline session in the experimental group (red line), whereas there was a slight increase, although not significant, in the control group (green line). Moreover, the two groups had different CSP duration in the final session. All the values are expressed as mean ± SE. **p < 0.010.
