. 2015 Apr 15;30(5):576–585. doi: 10.3346/jkms.2015.30.5.576

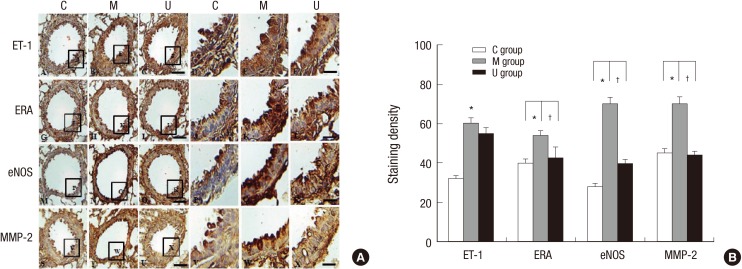
Fig. 4. Localization of ET-1, ERA, eNOS and MMP2-immunoreactive cells in the lung tissues at week 4. Immunohistochemical expressions revealed that the positive cells of ET-1, ERA, eNOS, and MMP-2 were significantly higher in the M group than the C group, however, they were lower in the U group than the M group (A). The increased levels of ET-1, ERA, eNOS, and MMP-2 immunoreactivity observed in the M group were statistically significant. The levels of ERA, eNOS, and MMP-2 immunoreactivity were significantly decreased in the U group compared with the M group (B). *P < 0.05 compared with the C group. P < 0.05 compared with the M group. C, control group; M, monocrotaline group; U, hUCB-MSCs group. Scale bars = 40 µm (A-C, G-I, M-O, S-U), 10 µm (D-F, J-L, P-R, V-X).

Fig. 4