
Figure 4.
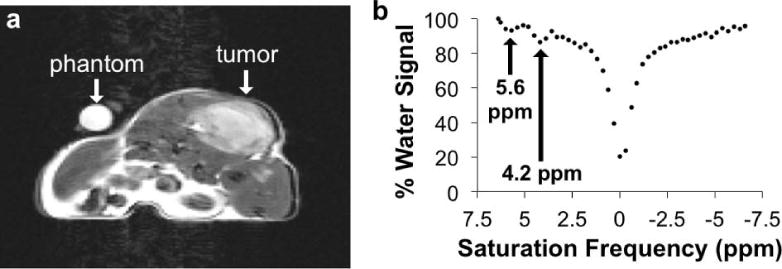
Monitoring a CEST MRI contrast agent within in vivo tissues. a) An axial MR image of a xenograft tumor model of MDA-MB-231 mammary carcinoma before injection showed the location of the tumor. b) The MR signals from the tumor region were measured in images acquired with a series of selective saturation frequencies, which were used to create a CEST spectrum. The CEST effects at 5.6 and 4.2 ppm arose from the exchangeable amide protons of the CEST agent, and the decreased water signal shown at 0 ppm arose from direct saturation of water. (Chen, Howison and Pagel, unpublished results).