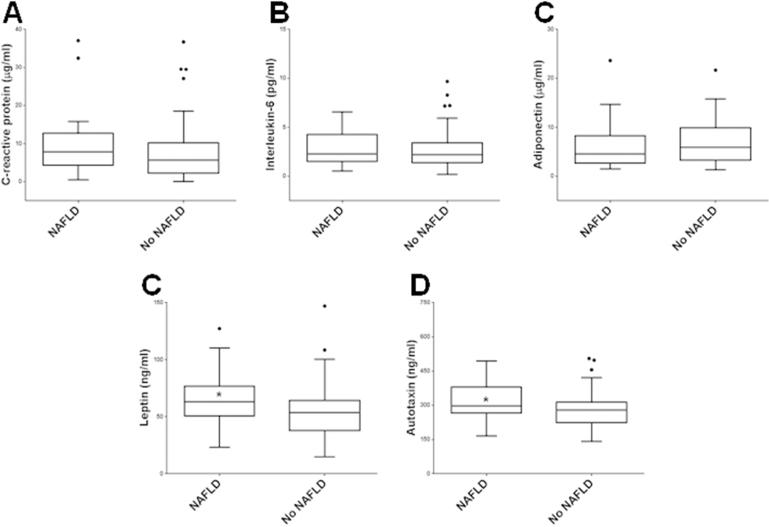
Figure 1.
Tukey box whisker plots of circulating concentrations of C-reactive protein, interleukin-6, adiponectin, leptin, and ATX in subjects with and without NAFLD. The Tukey method of box whisker plot was used to generate the box whisker plot: the difference between the 25th and 75th percentiles was defined as the interquartile range (IQR). The upper and lower limits of the whiskers were defined using the 75th percentile plus 1.5IQR and 25th percentile plus 1.5IQR, respectively, in comparison with the largest and smallest data set values. *, p < 0.05.

