
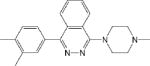
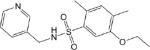
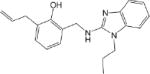
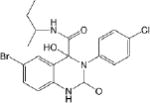
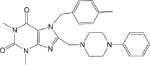
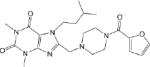
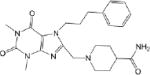
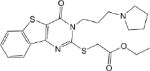
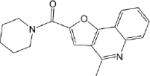
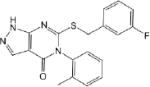
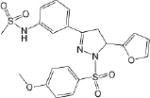
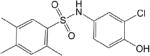
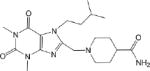
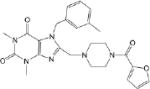
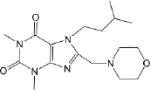
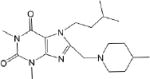
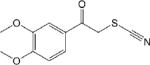
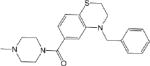
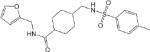
Table 2.
IC50 values with ALDH1A1 for compounds that inhibit dehydrogenase activity.
| Compound IC50 [μM] |
Structure |
|---|---|
| CM001 1.1 ± 0.1 * |
|
| CM009 5.3 ± 0.3 * |
|
| CM010 1.3 ± 0.1 * |
|
| CM020 0.45 ± 0.10 |
|
| CM025 2.1 ± 0.7 |
|
| CM026 0.80 ± 0.06 |
|
| CM028 2.0 ± 0.1 |
|
| CM037 4.6 ± 0.8 |
|
| CM038 0.26 ± 0.01 |
|
| CM039 0.41 ± 0.01 |
|
| CM045 2.5 ± 0.5 * |
|
| CM047 0.31 ± 0.03 * |
|
| CM053 0.21 ± 0.04 |
|
| CM055 0.24 ± 0.04 |
|
| CM056 5.4 ± 0.8 |
|
| CM057 0.92 ± 0.2 |
|
| CM302 1.1 ± 0.1 |
|
| CM306 3.5 ± 0.6 |
|
| CM307 0.57 ± 0.09 |
|
Each value represents mean/SEM for three independent assays, each n = 3. Values calculated using 100 μM Propionaldehyde and 200 μM NAD+.
*
Maximum inhibition < 70%.