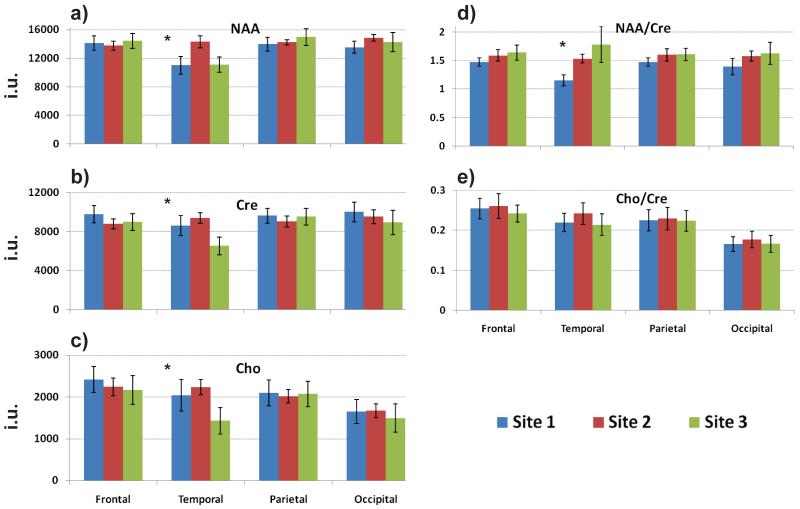
Figure 7.
Comparison of the regional mean values for the human MRSI results. Average (a) NAA, (b) Cre, and (c) Cho metabolite values and (d, e) their ratios obtained from the brain lobar analysis at the three Sites. Only results for the right brain hemisphere are shown. The asterisks indicate statistically significant inter-site differences, for p < 0.05.

