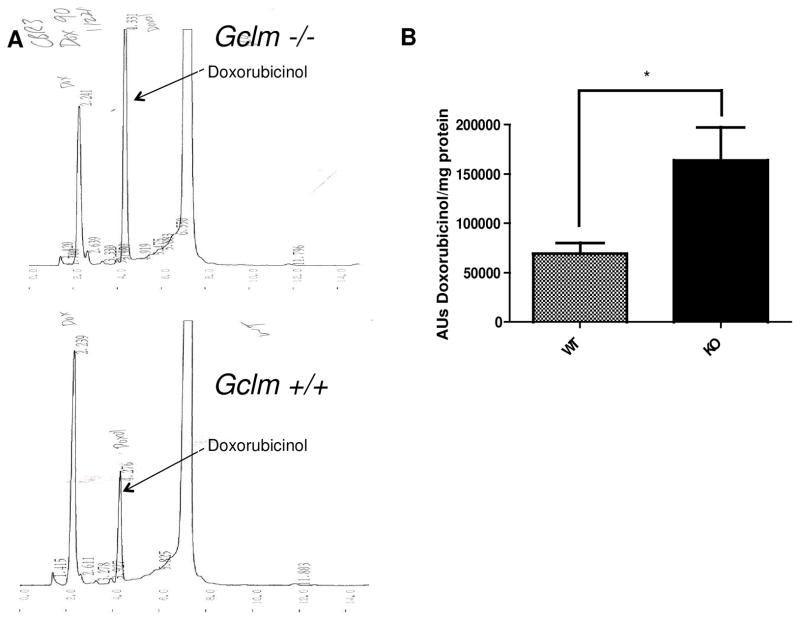
Figure 5.
Doxorubicinol formation by Gclm −/− and Gclm +/+ liver homogenates. (A) Representative HPLC chromatograms of doxorubicinol formation in Gclm −/− (top panel) and Gclm +/+ (bottom panel) dialyzed liver homogenates. (B) Quantification by HPLC of doxorubicinol formation (area units, AU) in dialyzed liver homogenates following incubation with 50 mM doxorubicin; n=4 per genotype. *indicates p < 0.05 for Student’s t-test relative to wild-type.

