Abstract
The SynCardia total artificial heart (TAH) has emerged as an effective, life-saving bi-ventricular replacement system for a wide variety of patients with end-stage heart failure. While the clinical performance of the TAH is established, modern physiologic characterization, in terms of elastance behavior and pressure-volume characterization has not been defined. Herein we examine the TAH in terms of elastance using a non-ejecting left-ventricle, and then characterize the pressure-volume relationship of the TAH by varying preload and afterload parameters using a Donovan Mock Circulatory System. We demonstrate that the TAH does not operate with time-varying elastance, differing from the human heart. Further, we show that the TAH has a pressure-volume relationship behavior that also differs from that of the human heart. The TAH does exhibit Starling-like behavior, with output increasing via preload dependent mechanisms, without reliance on an alteration of inotropic state within the operating window of the TAH. Within our testing range, the TAH is insensitive to variations in afterload, however this insensitivity has a limit, the limit being the maximum driving pressure of the pneumatic driver. Understanding the physiology of the TAH affords insight into the functional parameters that govern artificial heart behavior providing perspective on differences compared to the human heart.
Keywords: total artificial heart, elastance, pressure-volume relationship, Donovan mock circulation, mechanical circulatory support, heart failure
Introduction
The SynCardia total artificial heart (TAH) is a life-saving mechanical circulatory support device for patients with biventricular heart failure1,2. To date, the TAH has been implanted into more than 1,300 patients, with a demonstrated 79% bridge-to-transplantation rate, and utility for long-term support with patient survival reported up to four years3–7. While the hemodynamic performance of the TAH is established and clinically defined, full physiologic characterization of the TAH, in terms of modern cardiovascular physiology parameters, has not been described. The TAH was originally designed and functionally characterized in an era prior to the widespread adoption of pressure-volume characterization of cardiac function and mechanics8–11. As such, the functional behavior of the TAH in terms of elastance and pressure-volume relationships, ventricular-arterial interactions, and the effect of loading conditions remain unknown.
The human heart has multiple ways of altering cardiac output, including adjusting heart rate, contractility, and ventricular cavity volume and geometry in response to load conditions and demands. Traditionally, cardiac performance has been characterized via the Frank-Starling relationship, in terms of ventricular function curves, with output being a function of preload12,13. The limitation of this approach as a means of completely characterizing cardiac function was recognized in the 1970s with demonstration of the load-dependency of the relationship14–16. Cardiac contractility, described in terms of the end-systolic pressure-volume relationship, was noted to be independent of preload and afterload14,15. Thus, a load-independent approach was established with the recognition that the human heart behaves with time-varying elastance, reflecting alterations in tissue stiffness over time17–19. The TAH, in contrast, is constructed with a polymeric body that has consistent material composition and properties throughout the cardiac cycle3. How a functionally inelastic material construction will effect artificial heart performance remains unknown.
In the present study we hypothesize that the TAH will perform with Frank-Starling-like behavior, with output demonstrating load–dependency over a range of preloads, however, will have dissimilar pressure-volume characteristics compared to the human heart as a result of the functionally inelastic housing of the TAH. As such, we first verify the inelastic behavior of the TAH – i.e. the lack of time-varying elastance, second we characterize and define the pressure-volume (PV) relationship of the TAH under typical operating conditions, with the TAH connected to a Donovan Mock Circulatory loop. Third, we examine the effect of varying loading conditions – preload and afterload, on TAH PV behavior. Detailed characterization of the physiology of the TAH affords insight into the difference in behavior compared to the human heart and will potentially aid in development of physiological control algorithms for next generation artificial hearts.
Methods
The Total Artificial Heart
A 70 cc pneumatically driven, pulsatile Total Artificial Heart (SynCardia Systems Inc., Tucson, AZ) was utilized for all studies. Each of the TAH ventricles has a rigid spherical outer housing, supporting a blood-contacting diaphragm, two inner diaphragms, and an air contacting diaphragm, all fabricated together from segmented polyurethane (SPUS)3, Supplemental Figure 1. The air-contacting chamber is pressure controlled by an external driver, providing positive and negative air pressure to a driveline, functioning to mobilize the diaphragms and provide pulsatile pumping action required for blood flow. The negative pressure, or vacuum, applied during diastole functions to actively retract the diaphragm towards the base of the ventricular chamber, creating empty space in the cavity facilitating blood inflow and ventricular filling with minimal resistance. Under normal operating conditions the left drive pressure is set at 180 mmHg and operates under “full eject” parameters. That is, the diaphragm will always reach its maximum upward excursion position during systole, ensuring full ejection of the blood that entered the ventricular chamber during diastole. The external pneumatic driver allows for the control of drive and vacuum pressures for each ventricle, percent systole, and heart rate. The ventricles utilized each contained two tilting disk mechanical valves (Medtronic–Hall, Medtronic Inc. Minneapolis, MN), functioning as mitral/aortic and tricuspid/pulmonary valve surrogates.
Determination of Elastic Behavior of the TAH
Both the mitral and aortic valves of the left-ventricle of a TAH were maintained in a closed position while connected to the pneumatic driver set at 180 mmHg drive pressure. A 35% (w/v) glycerin/deionized water solution (blood surrogate) was added to the ventricle via syringe through a 2mm port in the wall of the ventricle, in 10 ml increments, until the ventricle was completely full. At each volume increment, data were collected for 10 seconds while the driver was pumping at 100 BPM; data were collected in triplicate. Maximum ventricular pressures during systole were collected and averaged and minimum ventricular pressures during diastole were collected and averaged for each collection period.
Hydraulic Analog of the Circulatory System - Donovan Mock Circulatory System (DMCS)
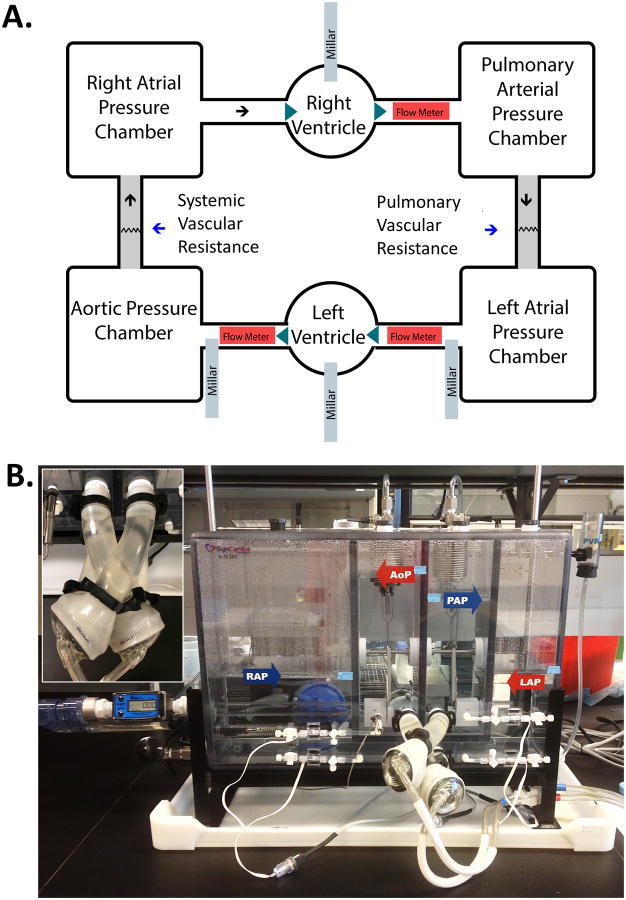
A DMCS (SynCardia Systems, Inc, Tucson, AZ) was used to simulate the systemic and pulmonary portions of the human vasculature for all experiments performed in this study20. Briefly, the DMCS contains four chambers representative of the following blood-containing domains: 1) right atrium, 2) pulmonary artery, 3) left atrial and 4) aorta, see Figure 1a for diagram of fluid flow through the DMCS. The pulmonary and systemic resistances are adjusted by bellows-operated valves within the DMCS. The tank was filled with 35% (w/v) glycerin/deionized water blood surrogate, viscosity 3.5 cps at room temperature. The TAH is attached to the DMCS with Tygon tubing (1″ ID), which acts as the working atria for the test setup.
Figure 1. Explanation of fluid flow through the DMC and TAH ventricles.
A) Fluid flow through the total artificial heart (right and left ventricle) and DMCS. The triangles represent inflow and outflow valves in the TAH. Systemic and pulmonary vascular resistances can be adjusted using bellows operated valves within the DMCS. B) The DMCS with attached total artificial heart. The inlet in the upper left corner is a close of up the TAH attached to the DMCS.
Experimental Configuration
All chambers of the DMCS were fitted with pressure transducers (Abbott, Abbott Park, Illinois) to provide the following pressures: Aortic pressure (AoP), left atrial pressure (LAP), right atrial pressure (RAP), and pulmonary artery pressure (PAP). Four Millar catheters, (SPR-524, Millar Instruments, Inc, Houston TX) connected to a pressure control unit (PCU-2000, Millar Instruments, Inc) were used to monitor continuous pressure at the entrance to the aortic chamber, inside the left ventricle, inside the right ventricle, and at the outflow of the LAP chamber (Figure 1a). Three flow meters (ME 25 PXN, Transonic Systems, Inc, Ithaca, NY) were placed throughout the system to measure fluid flow rates of left ventricular inflow, left ventricular outflow, and right ventricular outflow. Data from all sensors were acquired at 200 Hz with a compact data acquisition board (NI-9219, NI-9211, and two NI-9205, National Instruments, Austin, TX) interfaced with a custom LabView executable.
The TAH was driven by the Companion II pneumatic driver (SynCardia Systems, Inc, Tucson, AZ). Baseline “normal” driver conditions were: left drive pressure 180 mmHg, left vacuum -10, right drive pressure 60 mmHg, right vacuum -10, heart rate 100 beats per minute, and 50% systole. These conditions were chosen based on clinical and past characterization driver settings for the Companion II operating under normotensive patient conditions. Once baseline parameters were set on the driver, the DMCS was set to clinically relevant “normotensive” patient conditions: right atrial mean pressure 6 ± 5 mmHg, pulmonary arterial mean pressure 20 ± 5 mmHg, left atrial mean pressure 10 ± 5 mmHg, and AoP mean 85 ± 5 mmHg.
Effect of Alteration of Afterload and Preload on TAH Performance and System Hemodynamics
With the driver set at “normal” drive conditions and the DMCS tank set at “normotensive” conditions, 10 seconds of data were recorded after a steady state had been reached as baseline. The response of the TAH and DMCS to an increase in afterload was assessed by raising the systemic vascular resistance. A 10, 20, 30, 40 and 50 mmHg increase in AoP above the initial starting AoP (85 mmHg) was created. Similarly, the response of the TAH and the DMCS to an increase in preload was assessed by varying the vacuum pressure of the right ventricle between 0 and -20 (normal vacuum is -10) in increments of 4. This change in right vacuum pressure causes variations in the pumping action of the right ventricle by changing the speed at which the diaphragm is mobilized. As the vacuum is increased, the diagram moves towards the base of the ventricular chamber (downward) more quickly, allowing the ventricle to fill with less resistance. Thus, the change in right vacuum pressure will affect the preload on the left ventricle. The left fill volume is calculated by an algorithm within the driver software and is displayed during normal operation. At each increment this measurement was recorded. End diastolic volume was calculated by the addition of the fill volume and the residual volume of the TAH, 30ml. For all experiments, 10 seconds of data were recorded at 200 Hz at one time. All experiments were preformed in triplicate. Means were calculated using all data recorded. Pressure-volume loops were created using the 3rd data set collected.
Results
Determination of the Elastic Behavior of the TAH
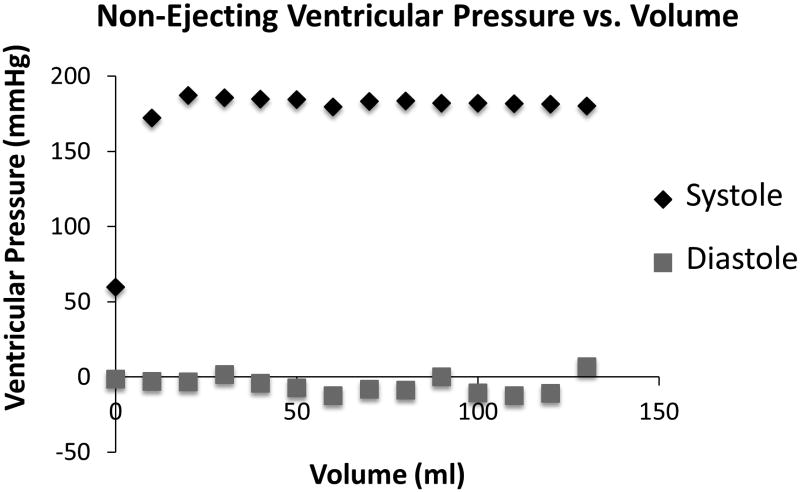
Incremental filling of the ventricle over a range of volumes did not lead to an increase in peak systolic pressure. Under non-ejecting operating conditions (drive pressure = 180 mmHg, 100 BPM) the pressure minimums and maximums obtained are shown in Figure 2 (maximum systolic pressures in black, minimum diastolic pressures in gray). These data indicate greater pressures are not achieved with additional volume within the ventricle, i.e. there is no change in compliance (dV/dP) or elastance (the inverse of compliance, dP/dV). As such the TAH, over the range of volume and pressure tested, does not manifest elastic behavior or the time-varying elastance properties of the human heart. This difference in behavior also impacts the pressure-volume relationship behavior of the TAH as will be seen below – see Figure 6. In Figure 6 with varying afterload the end-systolic relationship (ESPVR) i.e. is vertical, i.e. has infinite slope. This too differs from the behavior of the human heart, with the ESPVR of the human heart having a characteristic sloping behavior.
Figure 2. Non-Ejecting Left Ventricular Pressure vs. Volume.
The maximum pressure achieved during systole and the minimum pressure seen during diastole of a non-ejecting heart operating with 180 mmHg drive pressure as 10 ml of blood analog was added incrementally.
Figure 6. Varying the Preload.
A-C) Mean left atrial pressure, left ventricular pressure, and left ventricular outflow over a range of end diastolic volumes (preloads). End diastolic volumes were varied through variations of the right ventricular vacuum, which in turn varied the pumping action of the right ventricle thus varying filling into the left ventricle.
Hemodynamic Profile of the TAH under Normal Operating Conditions
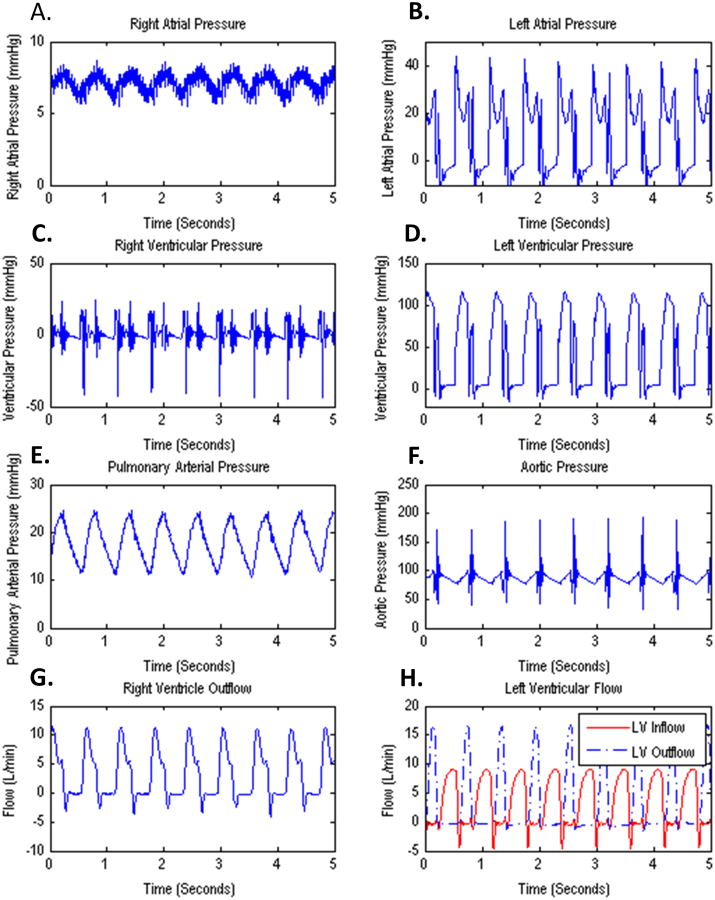
Typical hemodynamic profiles obtained with the TAH operating under normal drive conditions, with the DMCS set to normotensive patient conditions, are shown in Figure 3. The figure depicts 5 seconds of data (about 8 cardiac cycles) while the TAH was operating at 100 BPM with a left drive pressure of 180 mmHg. Spikes seen in the AoP waveform (3f) are due to a “bounce” or oscillatory movement of the mitral valve as it opens. The remaining channels depict pressures and flows fluctuating rhythmically with ventricular ejection. Bouncing of the mitral valve is similarly seen in the left ventricular pressure waveform as well, as a sharp spike after the pressure increase from systole. RAP (3a), varied between about 6 and 8 mmHg under normal conditions. The LAP (3b) varied between about -10 and 45 mmHg with an average value of about 9 mmHg, with a spike in pressure at the beginning of systole. This spike from 0 to 45 mmHg is similarly due to a bounce with the closure of the mitral valve. The right ventricular pressure waveform (3c) also has noisy regions at the opening of the pulmonary valve during ejection and with the closure of the valve. This is likely due to the valves oscillating for brief intervals of time, which is normal and can be seen during function. The left ventricular pressure (3d) varied between -32 and 124 mmHg, with a mean value of 85 mmHg. Waveforms demonstrated a clear increase in pressure with mitral valve closure and the initiation of systole. After peak systolic left ventricular pressure was reached, pressure was noted to fall but then rose quickly before becoming slightly negative (also seen clearly in the PV loops in Figure 5 and Figure 8). These quick changes in pressure are from the vacuum engagement of the driver, to speed the mobilization of the diaphragm for rapid ventricular filling and the bouncing of the mitral valve as it opens. The AoP waveform has obvious spikes with closure of the aortic valve; this flapping of the valve is noted to be normal and can be visibly seen during normal operation. Right ventricular outflow and left ventricular inflow and outflow waveforms (Figure 3) appear as expected with the TAH set at 50% systole. The negative flow, seen in the right ventricular outflow and left ventricular inflow waveforms, occurred briefly with valve closure, with fluid moving into the closed valve, resulting in a brief period of time when the flow meters register a negative flow.
Figure 3. Waveforms from all collection channels.
A-H) Output from all sensors with the TAH operating at normal driving conditions. The spikes seen in the aortic pressure waveform (F) are attributed to the normal “flapping” of the aortic valve as it closes. This flapping can also be seen in the left ventricular pressure trace immediately after ejection (D).
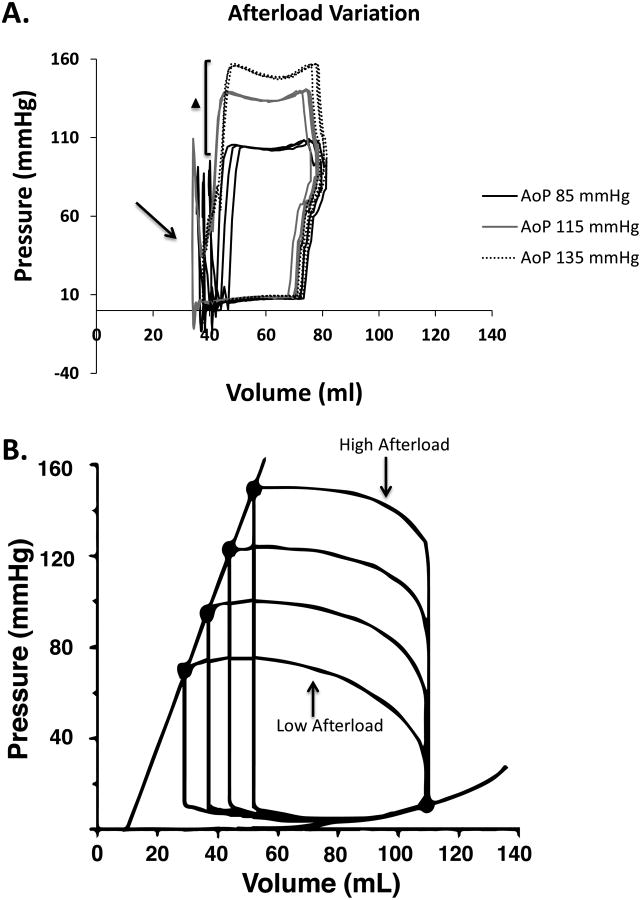
Figure 5. Pressure-Volume Loops with Varying Afterloads.
A) Pressure-volume loops from the TAH's left ventricle with the DMCS at 85, 115, and 135 mmHg aortic pressures. The arrow indicates the noise caused by the bouncing of the mitral valve as it is opening. Note the end-systolic pressures are at similar volumes depending on the afterload, indicated by the triangle and bracket. B) Shows the effect of afterload variation in a human ventricle (Adapted from Burkhoff et. al. 2005).
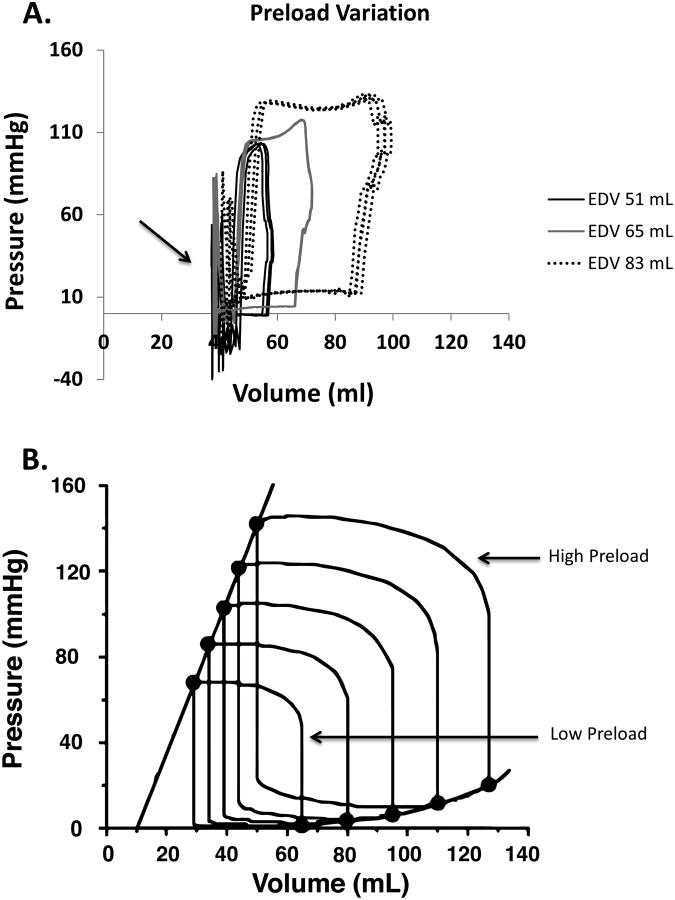
Figure 8. Pressure-Volume Loops with Varying Preloads.
A) Pressure-Volume loops from the TAH's left ventricle with variations in preload, end diastolic volumes (EDV) of 51, 65, and 83 ml are displayed. B) Shows the effect of varying preload on a human ventricle (Adapted from Burkhoff et. al. 2005).
Effect of Varying Afterload on TAH Performance and DMCS hemodynamics
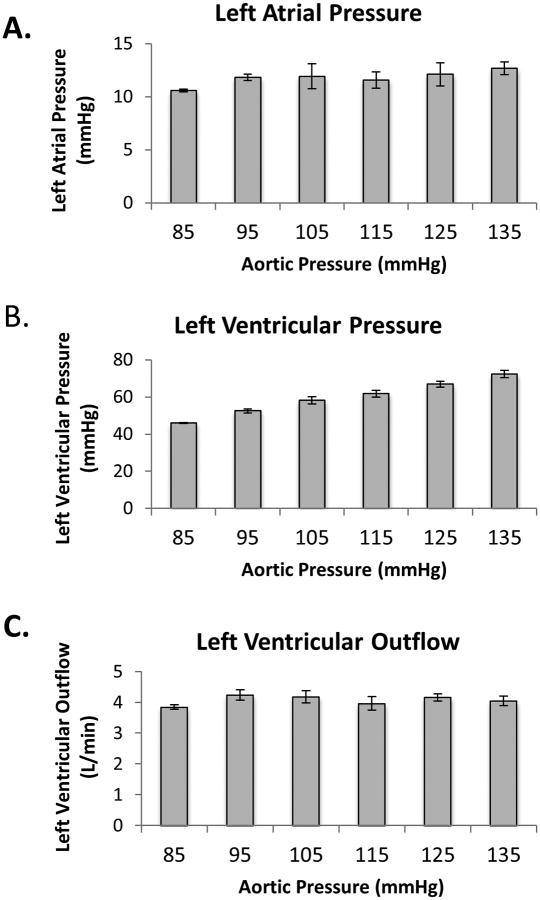
Afterload in the DMCS was increased by manipulating the bellows-operated valve to restrict flow between the AoP chamber and RAP chamber. Figure 4 (a-c) shows mean left atrial pressure, left ventricular pressure, and left ventricular outflow over a 10 second acquisition period with varying mean aortic pressures. As mean aortic pressure increased, there was a small increase in average left atrial pressure (4a) and a noticeable trend in the left ventricular pressure in relation to changes in AoP. As afterload was increased, mean ventricular pressure also increased (4b). There is no notable variation in left ventricular output, Figure 4c, despite changes in afterload. Figure 5a displays pressure-volume loops at three different afterload settings providing mean aortic pressures of 85, 115, and 135 mmHg. Between the three loops, there is an increase in ventricular pressure during systole, without large, noticeable differences in stroke volume. This shows that stroke work (area of the PV loop, stroke volume multiplied by pressure) increased with afterload, but cardiac output did not change, despite variations in afterload. The spikes seen on the left end of the loop are a result of mitral valve opening as filling begins. Figure 5b, adapted from Burkhoff et. al. 2005, shows the PV loop changes seen in a healthy human heart with increases in afterload21. As afterload is increased, the stroke volume decreased and ventricular pressure during systole increased. In contrast, the TAH variations in stroke volume are not seen with increases in afterload, so that cardiac output is not compromised. This relationship was noted to hold true over the range of afterloads tested. Waveforms from RAP, left ventricular pressure, AoP, and LAP during afterload variations can be seen in Supplemental Figure 2.
Figure 4. Varying the Afterload.
A-C) Mean left atrial pressure, left ventricular pressure, and left ventricular outflow over a range of aortic pressures. Afterload increase is represented as mean aortic pressure and was increased in increments of 10 between 85 and 135 mmHg using the systemic vascular resistance bellows operated valve within the DMCS.
Effect of Varying Preload on TAH Performance and DMCS Hemodynamics
Preload was altered through adjustments in the right ventricle's vacuum. The vacuum was varied between 0 and -20 mmHg (normal is -10 mmHg), causing end diastolic volumes (EDV) of the left ventricle to vary between 21 and 54 mL. Figure 6 (a-d) displays mean values for left atrial pressure, left ventricular pressure, AoP and left ventricular outflow over a 10 second acquisition period are displayed. Left atrial pressure (6a), ventricular pressure (6b), AoP (6c), and left ventricular outflow (6d) averages all increased with increases in preload (EDV). Waveforms from RAP, left ventricular pressure, AoP, and LAP during preload manipulations are shown in Supplemental Figure 3.
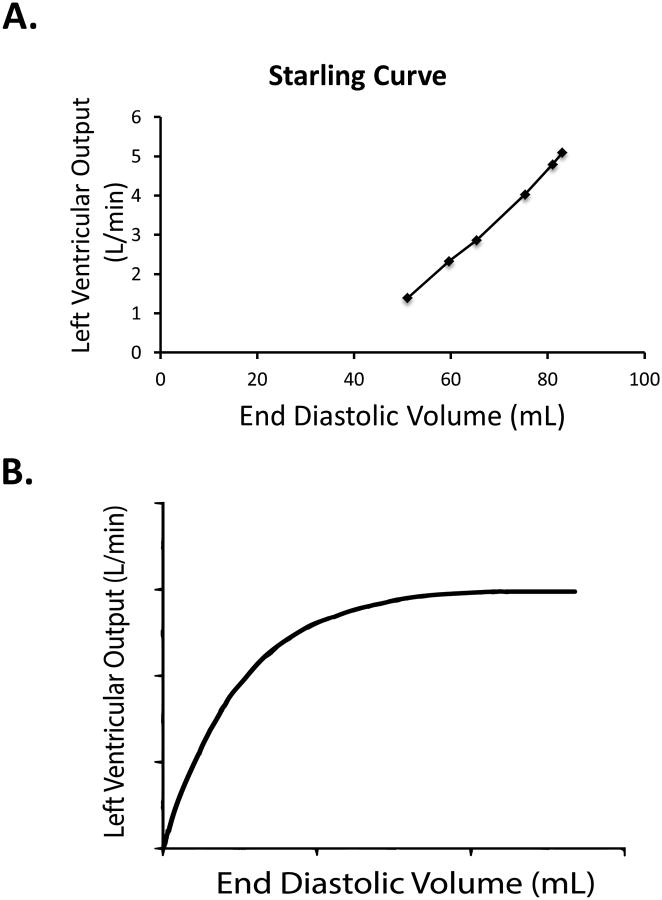
The preload/output relationship is shown in the Frank-Starling-like curve displayed in Figure 7a. This curve was created by comparing the end-diastolic volume with the left ventricular output as preload was adjusted. Figure 7b shows the Frank-Starling Curve in a normal human heart. The curve created with the TAH demonstrates increased output with increasing preload, similar to that observed with the human heart. However, the shapes of the two curves differ, as the TAH is inelastic. There is a linear relationship between fill volume and output in the TAH whereas the curve in a human heart is more logarithmic. The pressure-volume relationships created with preload variations are demonstrated in the PV loops shown in Figure 8a. Pressure spikes at the left of the loop are a result of mitral valve opening. As displayed with the average value plots (6a-d), increases in stroke volume with increased end-diastolic volume are seen. Higher left ventricular pressures are observed during systole and diastole when comparing the loops. Figure 8b, adapted from Burkhoff et. al. 2005, shows the reaction of a normal human heart to variations in preload21. As in the TAH, the human heart has increased stroke volume and increased ventricular pressure during systole with increases in end-diastolic volume.
Figure 7. Starling Curve.
Left Ventricular Output vs Left End Diastolic Volume (fill volume) in the TAH (A) and a typical human heart (B). Because the residual volume of the TAH is around 30 mL, the Starling-like curve created with the TAH does not intersect at the origin of the axis. Any end diastolic volume under 30 mL would result in no ejection.
Discussion
This study is the first to characterize the TAH using pressure-volume relationships and describe TAH function with varying preloads and afterloads on a beat-to-beat basis. Our findings verify the inelastic property of the TAH ventricle and the lack of time-varying elastance. We also demonstrate that the TAH operating under normal conditions is afterload insensitive up to the tested parameters, but is preload sensitive, demonstrating Frank-Starling-like behavior within a range of filling volumes. End-systolic and end-diastolic pressure-volume relationships seen in the human heart were not observed in the TAH as the housing of the ventricle is effectively rigid in comparison to the elastance of the human ventricle. Suga et. al. demonstrated that the non-ejecting canine ventricle displayed a pressure-volume relationship demonstrating elastance of the ventricular wall8. As volume was added to the non-ejecting ventricle, increased end-systolic pressure was also seen, i.e. a direct relationship. As shown in the non-ejecting TAH ventricle, Figure 2, this relationship does not hold true for the polymeric TAH. Thus, the TAH does not display the time-varying elastance characteristics of the human heart.
Overall, we see expected pressure and flow waveforms from the TAH operating with normal drive conditions under a normotensive patient load on the mock circulatory loop. We note that there are rapid fluctuations of pressures, yielding a noisy signal, due to closing and oscillations of the contained mechanical valves.
Pressure-Volume Relationships with Variation in Afterload and Preload
When afterload was varied, the most noticeable change occurred in the average left ventricular pressure, as the ventricle must reach a higher inner pressure for the aortic valve to open. Limited variation in cardiac output is expected as the TAH is operating in full ejection conditions. The diaphragm reaches its full upright position, ejecting all volume that enters the ventricle for that cardiac cycle as the afterload or AoP stays under 180 mmHg (the operating drive pressure). In a normal human heart, decreased cardiac output is seen with increased afterload, assuming there is no change in heart contractility. In contrast, the TAH does not demonstrate a significant change in left ventricular output with increased afterload, within our tested range. This is a result of the fact that the pneumatic driver exerts a pulse pressure able to overcome variations in afterload. These data reveal the difference in the behavior of the TAH in terms of end-systolic pressure-volume relationships compared to the human heart. No linear, end-systolic pressure-volume relationship regression could be created, as the TAH does not maintain the same end-systolic pressure-volume point as the load changes, i.e. the effective slope is infinite, with no elastance (Ees) line revealed from the TAH pressure-volume loops in Figure 5a.
In a pressure-volume loop, the phases of a cardiac cycle are displayed through plotting instantaneous pressure versus volume. Loops repeat with every cardiac cycle and display how the ventricle transitions from its end-diastolic state to the end-systolic state and back. In situations of increased afterload in the TAH, the width of each loop (loop width represents stroke volume) remains constant throughout the afterload variation, with increased ventricular pressure during systole. Thus, additional stroke work (area of the pressure-volume loop) is required per cardiac cycle, since the TAH is pumping against a higher load, without a substantial change in ventricular output. In contrast, in the human heart the width (stroke volume) of the PV loop is decreased with increases in afterload.
As preload is increased in the TAH, there is a clear increase in stroke volume and end-systolic volume is similar despite variations in preload (as a result of full ejection). From a pressure-volume relationship standpoint, we can create an end-diastolic pressure-volume relationship (EDPVR) curve using the six different tested preloads. However, it is difficult to relate the typical EDPVR curves to the curve generated by the TAH as the TAH is behaving effectively as a rigid body whereas an animal or human tissue ventricle has elastance. When a tissue ventricle is filled, the ventricular volume increases initially through passive filling and occupying of existing cavity space, but also via tissue stretch to further accommodate additional blood volume. In contrast, no stretching occurs within the TAH, as the housing is a non-yielding polymer and while the inner pumping diaphragm of the TAH is flexible, its positioning within the ventricle does not allow any increase in cavity volume. When the diaphragm is fully retracted, allowing the ventricle to fill, its excursion is limited by the bottom wall of the housing, which keeps it from expanding. Thus, the EDPVR's slope in this case is only based on the fluid pressure lying above the Millar port and not from elasticity of the ventricular wall.
In the human heart, the Frank-Starling Law dictates that with increased preload, cardiac output will be increased partially from a larger contraction force, resulting from loading of the ventricular muscular wall. In the case of the TAH, increased cardiac output occurs with increased preload. However, this is not from an increase in contractility, as the drive pressure remains constant during normal function. With additional venous return, resulting in a rise in end diastolic volume, the TAH's ventricle accommodates the additional volume, which is fully ejected. This mechanism is Frank-Starling-like and the trend is relatively linear, as the TAH is rigid, until the ventricle is fully filled. Once the ventricle is fully filled, additional volume cannot enter the ventricle and cardiac output will plateau even with increased preload as the maximum stroke volume of the TAH is 70 mL. The stroke volume limit, or high end on the Starling-like curve, will affect patient mobility or comfort specifically if the patient attempts high intensity activity22. However, during normal activity, the Starling-like ability of the TAH allows the device to respond to increased venous return just as a healthy heart would, increasing output relative to the preload delivered. On the low end, the TAH has a residual volume of about 30 mL. If end diastolic volume is ever under 30 mL, ejection will not occur. “Partial fill, full eject” only applies to the filled volume during a cardiac cycle; the filled volume is always fully ejected, but the residual volume will remain in the ventricle. As with the EDPVR, a typical end systolic pressure-volume relationship (ESPVR) curve cannot be generated for the TAH, as the walls of the ventricle do not contract (see Supplemental Figure 1). For the TAH, contraction occurs as a result of diaphragm displacement.
Limitations of the Study
To fully explore the full operating envelope of the TAH, a wider range of preloads and afterloads needs to be tested. These studies are planned for the future. We assume that the Starling-like mechanisms are limited by the high, fully filled volume of the ventricle and the low, residual volume of the ventricle. However, we were unable to reach these end-diastolic volumes using the parameters varied in this testing. In the case of varied afterloads, we assume that the TAH is insensitive to variations up to the maximum drive pressure of the driver. However, we were unable to verify this assumption with test parameters as with the DMCS, as we were limited in that we could not raise the aortic pressure higher than 135 mmHg without changing other parameters that were held constant throughout all other experiments.
We acknowledge the existence of other mock circulatory systems that may have additional features with better modeling of patient vasculature and compliance23–25. However, the DMCS has proven to be a success in testing the TAH in the past, was used in the FDA approval process of the TAH, and is widely distributed in medical centers that implant the device. The volume of liquid within the inflow tubing of each ventricle acts as the working atria for the test setup. While typical left atrial volumes can vary between 25 and 77 ml in a healthy male, the inflow tubing contained a larger than typical atrial volume due to incorporation of flow meters and tubing, creating a larger preload compared to typical human anatomy26. However, as preload is varied throughout the course of the studies performed, we were still able to see the effects of preload variation on the TAH, despite the large atrial volume on the DMCS.
Conclusion
This study defines the pump performance properties of the TAH in terms of pressure-volume characteristics. The TAH does not manifest or behave with time-varying elastance. Nevertheless, the TAH operates with Frank-Starling-like behavior in response to changes in preload and with insensitivity to afterload variation, over the range of pressure tested, i.e. up to a mean AoP of 135 mmHg. Although the present TAH has a smaller operating window compared to the human heart, i.e. it cannot achieve stroke volumes higher than 70 ml, nor vary contractile strength without changing driver settings, the TAH by virtue of its defined maximum volume, set material property, and defined non-varying elastance can operate equally well, i.e. providing cardiac output comparable to the human heart, over a wide range of loading conditions.
The characterization of the pneumatically driven SynCardia TAH that has emerged in this study may aid in the development of physiological control algorithms, next generation TAH designs, and will further our understanding of how the TAH performs in patients over a range of hemodynamic conditions. In the future, the construction of an artificial heart with expansile volume capabilities and time-varying elastance properties might extend the operating envelope of the artificial heart, bringing it closer to the maximum range of human physiologic parameters.
Supplementary Material
Acknowledgments
Conflicts of Interest and Sources of Funding: Partial support for this research was provided by the Cardiovascular Biomedical Engineering Training Grant, National Institutes of Health T32HL007955.
References
- 1.Copeland JG, Smith RG, Arabia FA, et al. Cardiac Replacement with a Total Artificial Heart as a Bridge to Transplantation. N Engl J Med. 2004;351:859–867. doi: 10.1056/NEJMoa040186. [DOI] [PubMed] [Google Scholar]
- 2.Leprince P, Bonnet N, Varnous S, et al. Patients with a body surface area less than 1.7 m2 have a good outcome with the CardioWest Total Artificial Heart. J Heart Lung Transplant. 2005;24:1501–5. doi: 10.1016/j.healun.2005.01.016. [DOI] [PubMed] [Google Scholar]
- 3.Slepian MJ, Smith RG, Copeland JG. The SynCardia CardioWest Total Artificial Heart. In: Baughman Baumgartner., editor. Treatment of Advanced Heart Disease. Taylor and Francis; 2006. pp. 473–490. [Google Scholar]
- 4.Kirklin J, Naftel D, Kormos R. The Fourth INTERMACS Annual Report: 4,000 implants and counting. J Hear Lung Transplant. 2012 doi: 10.1016/j.healun.2011.12.001. [DOI] [PubMed] [Google Scholar]
- 5.Platis A, Larson DF. CardioWest temporary total artificial heart. Perfusion. 2009;24:341–6. doi: 10.1177/0267659109351330. [DOI] [PubMed] [Google Scholar]
- 6.Kirsch M, Mazzucotelli JP, Roussel JC, et al. Survival after biventricular mechanical circulatory support: does the type of device matter? J Heart Lung Transplant. 2012;31:501–8. doi: 10.1016/j.healun.2011.11.024. [DOI] [PubMed] [Google Scholar]
- 7.Copeland JG, Arabía Fa, Banchy ME. The CardioWest total artificial heart bridge to transplantation: 1993 to 1996 national trial. Ann Thorac Surg. 1998;66:1662–9. doi: 10.1016/s0003-4975(98)00896-0. [DOI] [PubMed] [Google Scholar]
- 8.Suga H, Sagawa K. Instantaneous Pressure-Volume Relationships and Their Ratio in the Excised, Supported Canine Left Ventricle. Circ Res. 1974;35:117–126. doi: 10.1161/01.res.35.1.117. [DOI] [PubMed] [Google Scholar]
- 9.Sunagawa K, Maughan WL, Burkhoff D, Sagawa K. Left ventricular interaction with arterial load studied in isolated canine ventricle. Am J Physiol. 1983;245:H773–80. doi: 10.1152/ajpheart.1983.245.5.H773. [DOI] [PubMed] [Google Scholar]
- 10.Suga H, Sagawa K, Shoukas A. Load independence of the instantaneous pressure-volume ratio of the canine left ventricle and effects of epinephrine and heart rate on the ratio. Circ Res. 1973 doi: 10.1161/01.res.32.3.314. [DOI] [PubMed] [Google Scholar]
- 11.Sagawa K, Suga H, Shoukas aa, Bakalar KM. End-systolic pressure/volume ratio: a new index of ventricular contractility. Am J Cardiol. 1977;40:748–53. doi: 10.1016/0002-9149(77)90192-8. [DOI] [PubMed] [Google Scholar]
- 12.Starling E, Visscher M. The Regulation of the Energy Output of the Heart. J Physiol. 1927 doi: 10.1113/jphysiol.1927.sp002355. [DOI] [PMC free article] [PubMed] [Google Scholar]
- 13.Sarnoff S, Berglund E. Ventricular Function I. Starling's Law of the Heart Studied by Means of Simultaneous Right and Left VEntricular Function Curves in the Dog. Circulation. 1954;IX:706–718. doi: 10.1161/01.cir.9.5.706. [DOI] [PubMed] [Google Scholar]
- 14.Suga H. Time Course of Left Ventricular Pressure-Volume Relationship under Various Enddiastolic Volume. Jpn Heart J. 1969:509–515. doi: 10.1536/ihj.10.509. [DOI] [PubMed] [Google Scholar]
- 15.Suga H. Time Course of Left Ventricular Pressure-Volume Relationship under Various Extents of Aortic Occlusion. Jpn Heart J. 1970 doi: 10.1536/ihj.11.373. [DOI] [PubMed] [Google Scholar]
- 16.Sagawa K. The end-systolic pressure-volume relation of the ventricle: definition, modifications and clinical use. Circulation. 1981;63:1223–1227. doi: 10.1161/01.cir.63.6.1223. [DOI] [PubMed] [Google Scholar]
- 17.Glower D, Spratt J, Snow N, Kabas J. Linearity of the Frank-Starling relationship in the intact heart: the concept of preload recruitable stroke work. Circulation. 1985 doi: 10.1161/01.cir.71.5.994. [DOI] [PubMed] [Google Scholar]
- 18.Starling MR, Walsh Ra, Dell'Italia LJ, Mancini GB, Lasher JC, Lancaster JL. The relationship of various measures of end-systole to left ventricular maximum time-varying elastance in man. Circulation. 1987;76:32–43. doi: 10.1161/01.cir.76.1.32. [DOI] [PubMed] [Google Scholar]
- 19.McKay RG, Aroesty JM, Heller GV, Royal HD, Warren SE, Grossman W. Assessment of the end-systolic pressure-volume relationship in human beings with the use of a time-varying elastance model. Circulation. 1986;74:97–104. doi: 10.1161/01.cir.74.1.97. [DOI] [PubMed] [Google Scholar]
- 20.Donovan FM. Design of a hydraulic analog of the circulatory system for evaluating artificial hearts. Biomater Med Devices Artif Organs. 1975:439–49. doi: 10.3109/10731197509118635. [DOI] [PubMed] [Google Scholar]
- 21.Burkhoff D, Mirsky I, Suga H. Assessment of systolic and diastolic ventricular properties via pressure-volume analysis: a guide for clinical, translational, and basic researchers. Am J Physiol. 2005 doi: 10.1152/ajpheart.00138.2005. [DOI] [PubMed] [Google Scholar]
- 22.Gregory SD, Timms D, Gaddum N, Mason DG, Fraser JF. Biventricular assist devices: a technical review. Ann Biomed Eng. 2011;39:2313–28. doi: 10.1007/s10439-011-0348-8. [DOI] [PubMed] [Google Scholar]
- 23.Pantalos GM, Koenig SC, Gillars KJ, Giridharan Ga, Ewert DL. Characterization of an Adult Mock Circulation for Testing Cardiac Support Devices. ASAIO J. 2004;50:37–46. doi: 10.1097/01.mat.0000104818.70726.e6. [DOI] [PubMed] [Google Scholar]
- 24.Timms DL, Gregory SD, Greatrex Na, Pearcy MJ, Fraser JF, Steinseifer U. A compact mock circulation loop for the in vitro testing of cardiovascular devices. Artif Organs. 2011;35:384–91. doi: 10.1111/j.1525-1594.2010.01088.x. [DOI] [PubMed] [Google Scholar]
- 25.Timms D, Hayne M, McNeil K, Galbraith A. A complete mock circulation loop for the evaluation of left, right, and biventricular assist devices. Artif Organs. 2005;29:564–72. doi: 10.1111/j.1525-1594.2005.29094.x. [DOI] [PubMed] [Google Scholar]
- 26.Wang Y, Gutman J. Atrial Volume in a Normal Adult Population by Two-dimensional Echocardiography. CHEST. 1984:595–601. doi: 10.1378/chest.86.4.595. [DOI] [PubMed] [Google Scholar]
Associated Data
This section collects any data citations, data availability statements, or supplementary materials included in this article.


