
Fig. 5.
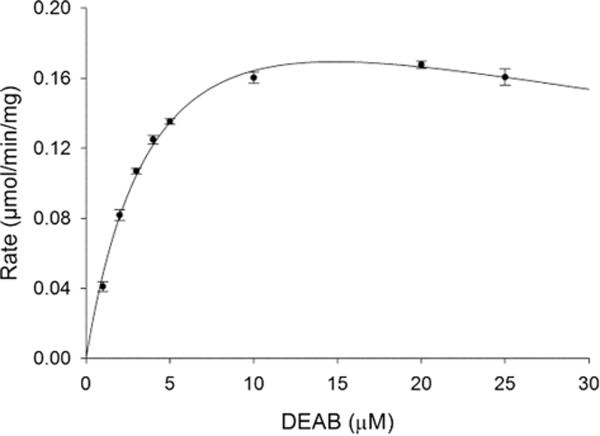
Substrate saturation curve for ALDH3A1 with DEAB as a substrate. This curve represents one of three experiments, each n = 3, it to the substrate inhibition equation.
Official websites use .gov
A
.gov website belongs to an official
government organization in the United States.
Secure .gov websites use HTTPS
A lock (
) or https:// means you've safely
connected to the .gov website. Share sensitive
information only on official, secure websites.
Substrate saturation curve for ALDH3A1 with DEAB as a substrate. This curve represents one of three experiments, each n = 3, it to the substrate inhibition equation.