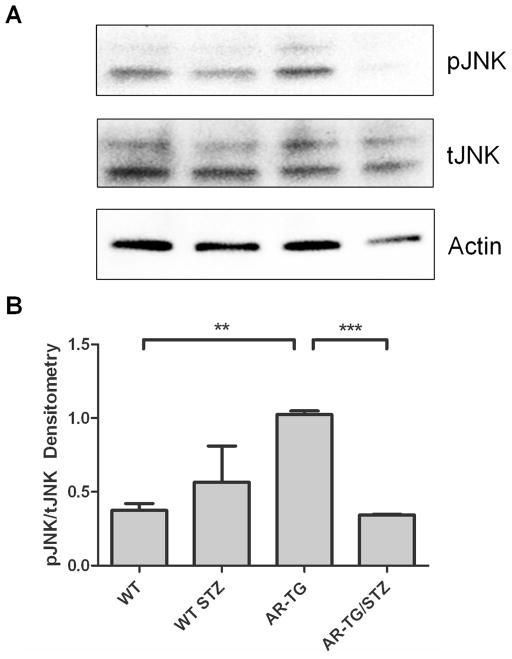
Figure 6.
Western blot and densitometry of mice lenses. (A) Western blot of pJNK1/2, tJNK1/2, and actin. (B) There was a significant difference between pJNK/tJNK in wild type (WT) and AR-TG mice with p ≤ 0.01 (**). The ratio of pJNK/tJNK was significantly lower in ARTG/STZ) mice compared to AR-TG mice with p ≤ 0.001 (***)[20]. Levels were normalized to actin. Data are the mean ± SEM of two experiments (n=2).

