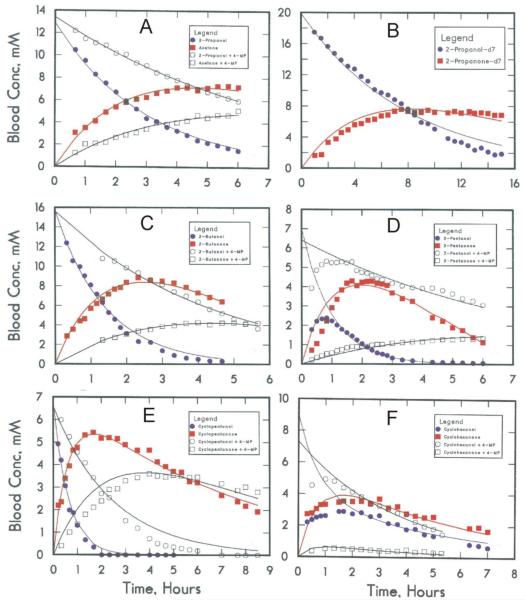
Fig. 3.
Elimination of secondary alcohols. In each sub-figure, the concentration of alcohol is represented by filled circle (●), its corresponding ketone by a filled square (■), and the results when another rat was given 1 mmole/kg of 4-methylpyrazole are represented by the open symbols, alcohol (○) and ketone (□). (A) 2-propanol, 10 mmole/kg; (B) 2-propanol-d7, 15 mmole/kg; (C) 2-butanol (racemic mixture of isomers), 10 mmole/kg; (D) 3-pentanol, 5 mmole/kg; (E) cyclopentanol, 5 mmole/kg; (F) cyclohexanol, 5 mmole.kg. The lines represent the fitted values from simultaneous non-linear least squares fits of data for alcohol and ketone for the uninhibited (or inhibited) state to the differential equations for the first order, sequential reactions.

