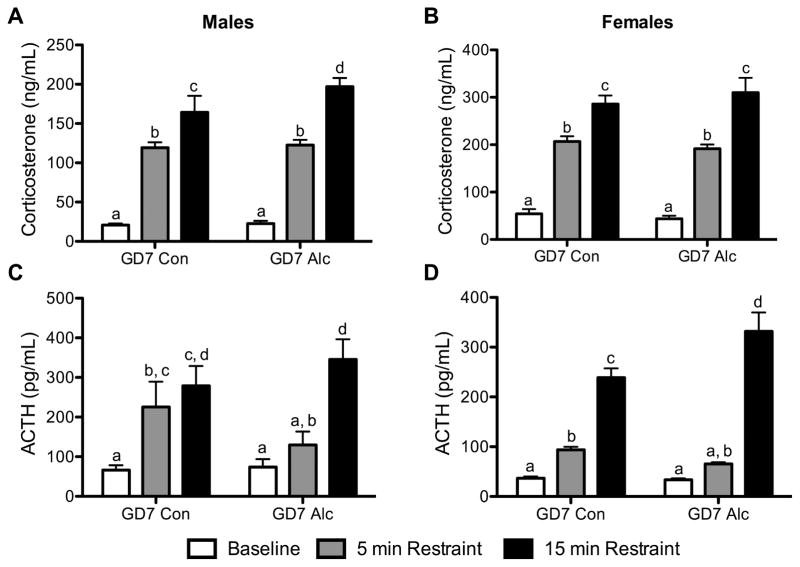
Figure 1. PAE increases HPA axis activity after acute restraint stress.
CORT (A,B) and ACTH (C,D) were measured under basal conditions and after 5 min and 15 min of restraint stress in males (left column) and females (right column). Letters above each bar (a, b, c, or d) denote the groups that are statistically similar, e.g., a bar with the letter ‘a’ above it is statistically similar to all other bars with an ‘a’ above them. All groups that are statistically different have p’s < 0.05. Male (n’s) = baseline (13–17), 5 min (7–11), 15 min (47); female (n’s) = baseline (12–17), 5 min (7–9), 15 min (5–7).

