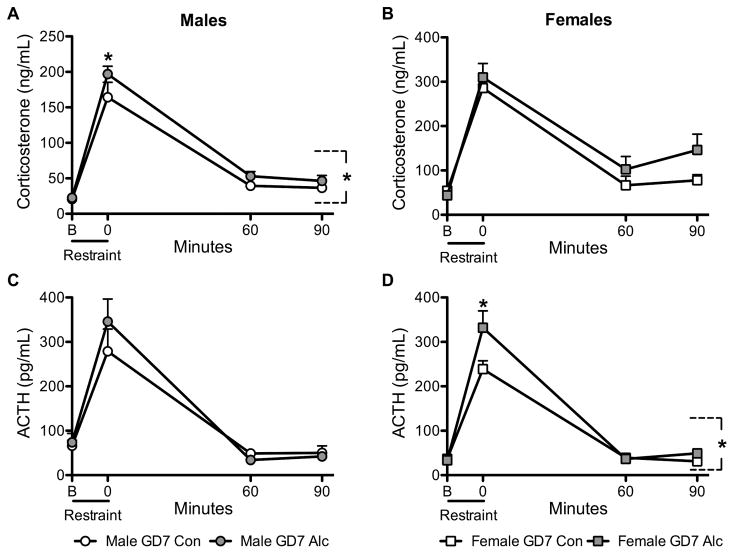
Figure 2. PAE increases HPA axis activity over time following acute restraint stress.
CORT (A,B) and ACTH (C,D) were measured 60 and 90 min following a 15-min restraint period in males (left column) and females (right column). The baseline and 15-min restraint time points shown in Fig. 1 were graphed in Fig. 2 as B and 0 min, respectively, in order to better depict the profile of CORT and ACTH levels over time. *with bracket p < 0.05, significant main effect of prenatal treatment; *p < 0.05, GD7 Alc vs. GD7 Con; Male (n’s) = baseline (13–17), 5 min (7–11), 15 min (4–7), 60 min (4–7), 90 min (3––6); female (n’s) = baseline (12–17), 5 min (7–9), 15 min (5–7), 60 min (5–7), 90 min (4–7).

