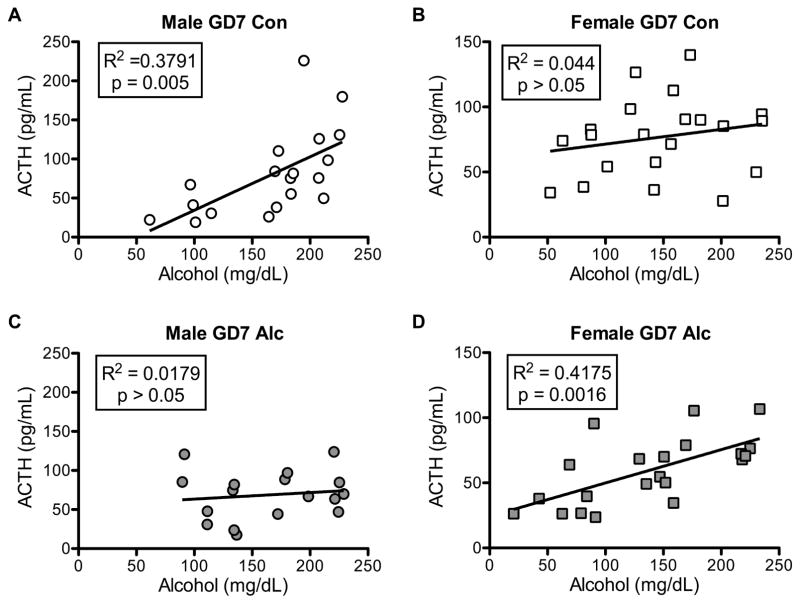
Figure 4. PAE and sex interact to influence the relationship between BACs and ACTH levels.
Regression analysis of BACs and ACTH levels in males (left column) and females (right column) exposed prenatally to vehicle (Ringer’s solution) (A,B) or alcohol (C,D). BACs and ACTH levels positively correlate in male GD7 Con and female GD7 Alc mice but not male GD7 Alc and female GD7 Con mice. Male (n’s) = GD7 Con (19), GD7 Alc (17); female (n’s) = GD7 Con (21), GD7 Alc (21).

