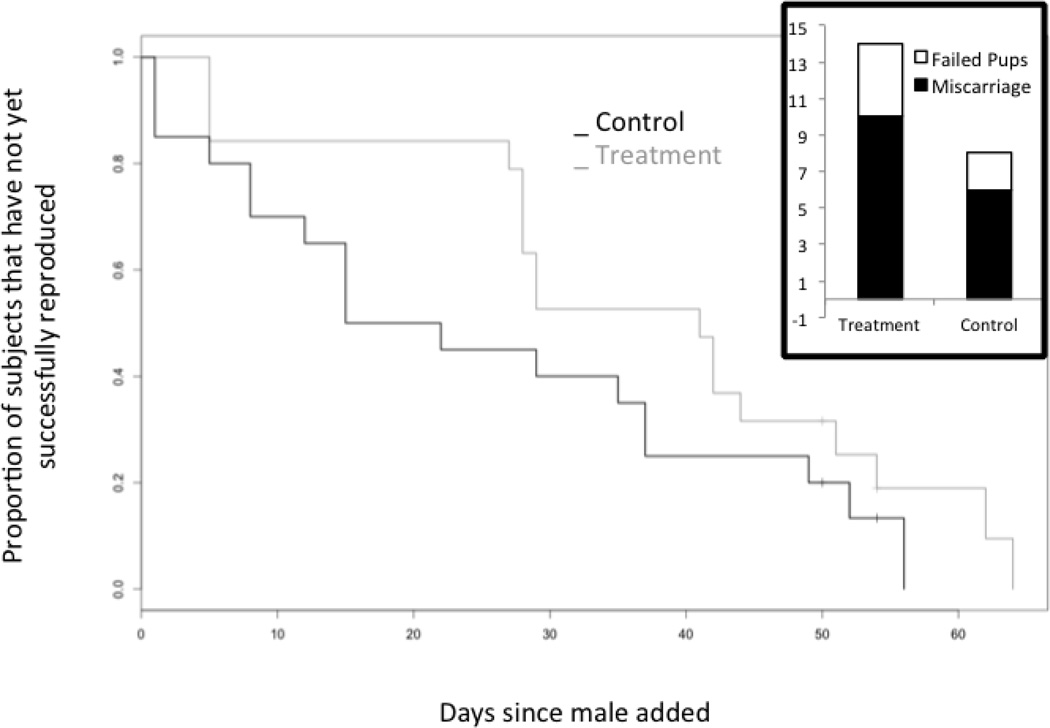
Figure 2. Effect of treatment on reproduction.
Time to event curves representing the proportion of subject females that have yet to successfully reproduce relative to the day the first male was introduced for mating (Cox proportional hazard, p=0.164). Gray line represents the treatment group, black line represents control group. Inset graph, demonstrates the number of first pregnancies that failed due to miscarriages or dead pups, (n=19 first pregnancies in each group) (Fisher’s exact test, p=0.099).

