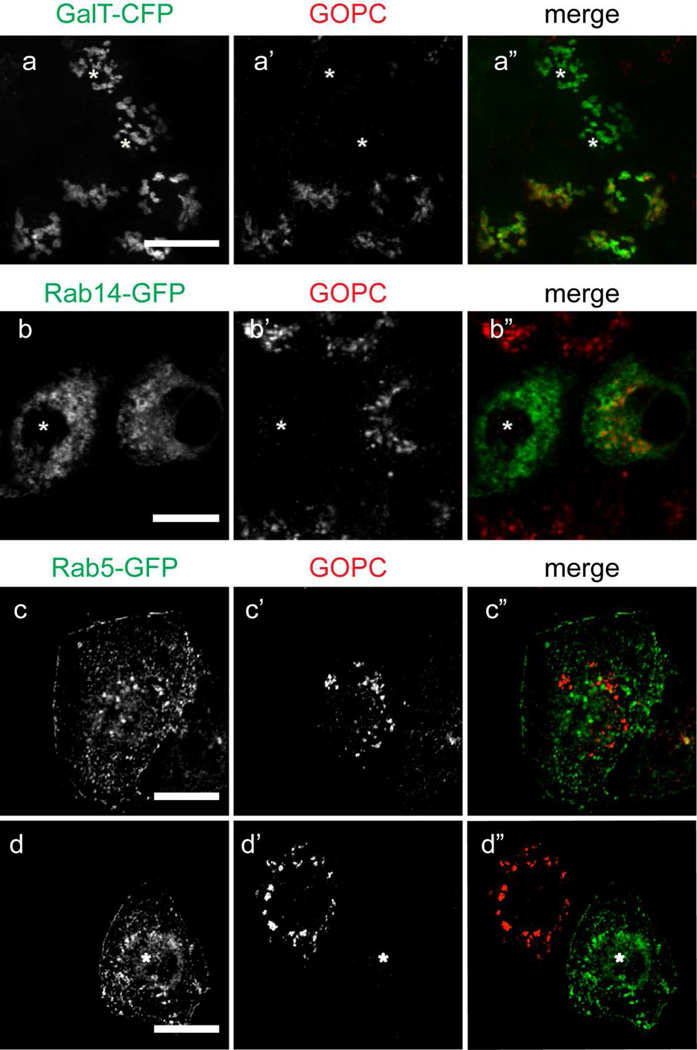
Figure 8.
(a-a”) GOPC-KD cells transfected with galactosyltransferase-CFP (a) were fixed and labeled for GOPC (a’). Knockdown cells are indicated with an asterisk. GOPC knockdown does not change the distribution of galactosyltransferase-CFP when compared with adjacent cells that have not been knocked down for GOPC (a”). (b-b”) GOPC-KD cells were transfected with Rab14-GFP (b) and labeled for GOPC (b’). There is no change in the distribution of Rab14-GFP after GOPC knockdown (b”). (c–d”) GOPC-KD cells were transfected with Rab5-GFP (c, d). GOPC knockdown does not change the distribution of Rab5 when compared with control cells (c”, d”). Knockdown cells are indicated with (*). Scale bars, 10µm. Representative images are from at least 3 experiments.

