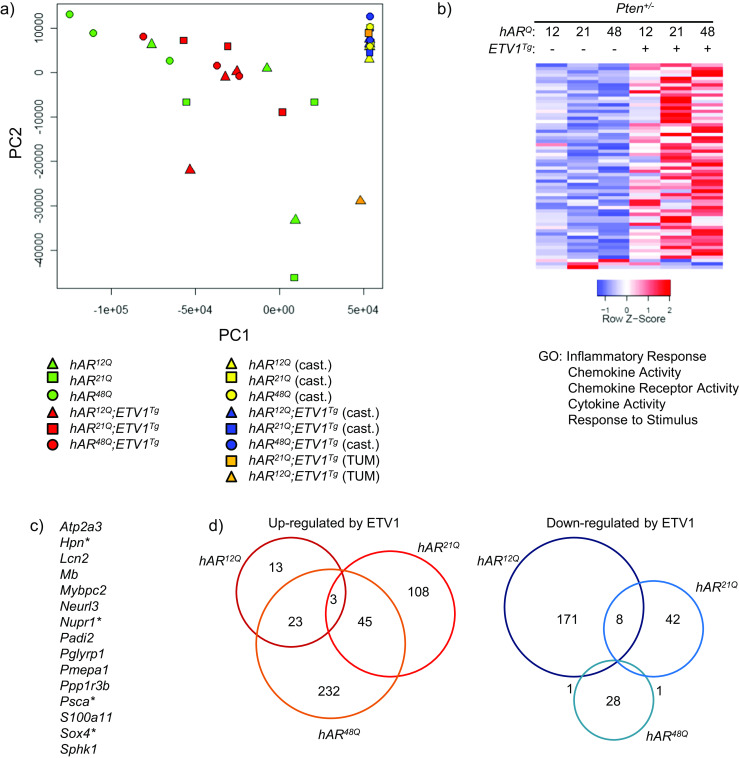
Fig. 7.

ETV1 overexpression alters genome-wide expression in Pten-hemizygous mice. a Principal component analysis was performed for all genes among the individual RNA-seq libraries. hAR 12Q, hAR 21Q, and hAR 48Q mice are represented as triangles, squares, and circles, respectively. Green and red represent intact non-transgenic and transgenic mice, yellow and blue represent castrated non-transgenic and transgenic mice, and orange represents macroscopic tumors, respectively. b RNA-seq analysis was performed on DLP RNA as before. Heatmaps include differentially expressed genes between the groups shown (FDR ≤ 0.05), with columns representing the average among biological replicate libraries. By GLM analysis of all hAR;ETV1 Tg ;Pten +/− libraries vs. all hAR;Pten +/− libraries, 59 genes are upregulated and 3 downregulated in prostates of hAR;ETV1 Tg ;Pten +/− mice. Select significantly enriched GO terms are listed. c ETV1-upregulated genes shared among Pten +/− and Pten +/+ mice are listed. d Differential expression was performed between transgenics and non-transgenics for each AR Q-tract group individually. Overlap between genes differentially expressed in hAR 12Q ;ETV1 Tg, hAR 21Q ;ETV1 Tg or hAR 48Q ;ETV1 Tg relative to non-transgenics is illustrated by Venn diagram
