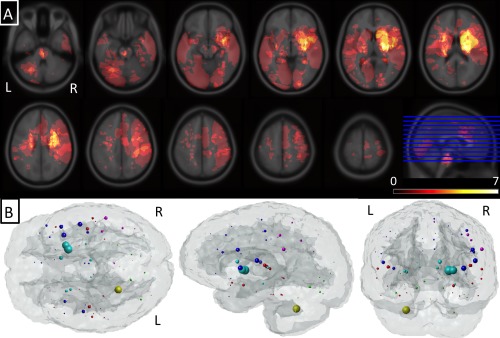
Figure 1.

Summary of lesion location and structural connectome disruption. (Panel A) A voxelwise heat map of the lesions across the population. (Panel B) Mean ChaCo score for each region over the population of 41 subjects. Each sphere is located at the center of the corresponding GM region and its size is proportional to that region's mean ChaCo score (bigger = more network disruption). Colors indicate regional assignment to larger grouping (blue = frontal, magenta = parietal, red = temporal, cyan = subcortical and yellow = cerebellar).
