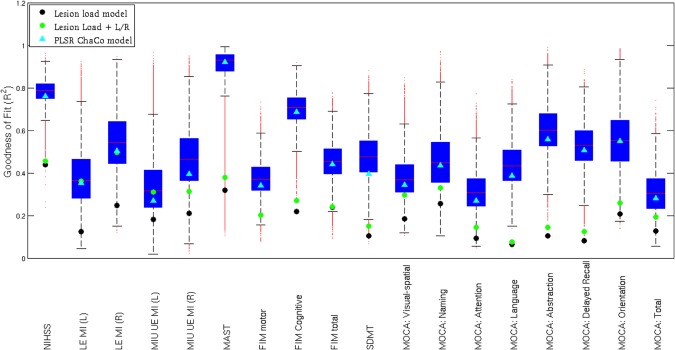
Figure 2.

The model fit summary for each clinical assessment NIHSS, LE MI (lower extremity motricity index), UE MI (upper extremity motricity index), MAST, Functional Independence Measure (FIM), SDMT, and MoCA. The R 2 for the linear regression models based on lesion volume are represented by black circles, the R 2 for the linear regression models based on lesion volume and lateralization are represented by green circles, and the R 2 for the fixed‐effects PLSR models based on ChaCo scores are given by cyan triangles. The distribution of R 2 values for the random‐effects bootstrapped PLSR models based on ChaCo are given by boxplots that visualize the median (red line), interquartile range (blue box), range of the most extreme points not considered outliers (black whiskers) and outliers (red points). [Color figure can be viewed in the online issue, which is available at http://wileyonlinelibrary.com.]
