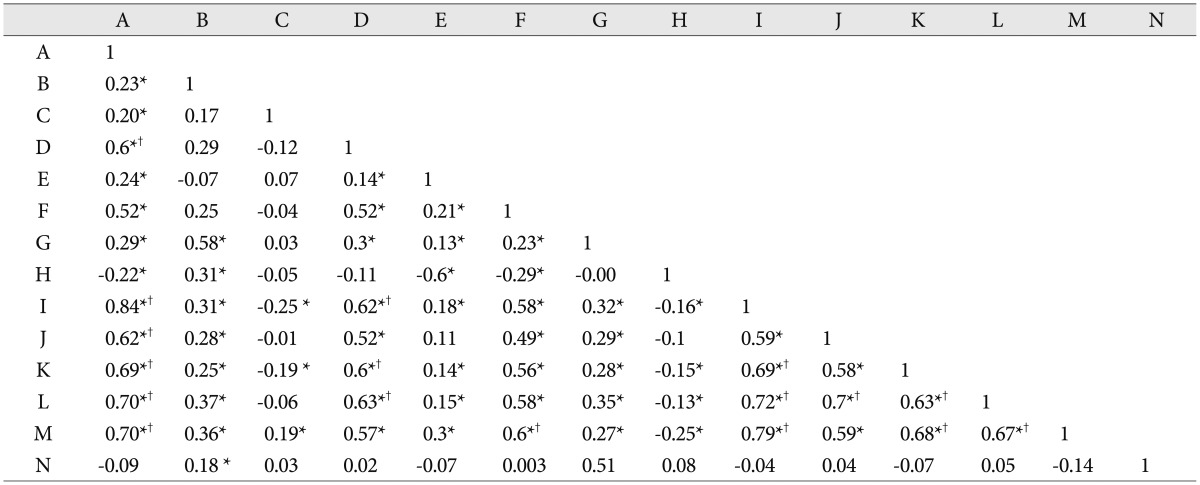
Table 4. Pearson correlation scores between multiple variables.

*Statistical significance, †The strong correlation scores (≥0.6). A : age, B : O-AP distance, C : McRae Line, D : C1 anterior arch height, E : power's ratio, F : posterior arch height, G : C1-AP diameter, H : O-C1 distance, I : odontoid height, J : odontoid AP diameter, K : C2 body height, L : C2 body AP diameter, M : B-C2 distance, N : PB-C2 distance
