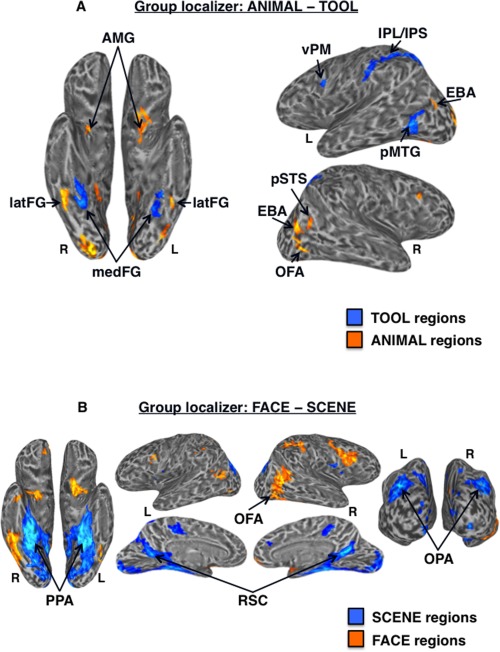
Figure 2.

Group‐level functional localizer results. (A) Regions showing significantly higher activation for tools (cool colors) versus animals (warm colors) in the functional localizer at the group‐level (n = 33) displayed on partially inflated ventral (left) and lateral (right) cortical surfaces. TOOL regions included bilateral medFG (VOTC‐TOOL) and left pMTG, IPS, IPL, and vPM; ANIMAL regions included bilateral latFG (VOTC‐ANIMAL), EBA, AMG, and right OFA and pSTS. (B) Regions showing significantly higher activation for scenes (cool colors) versus faces (warm colors) in the functional localizer at the group‐level (n = 33) displayed on partially inflated ventral (left), lateral (top middle), medial (bottom middle), and posterior (right) cortical surfaces. SCENE regions included bilateral PPA, RSC, and OPA; the FACE ROI was the right OFA. Activations are t‐statistic maps displayed at node‐wise threshold P < 0.001; whole‐brain threshold P < 0.01, FDR corrected; minimum cluster size of 50 nodes. L, left; R, right.
