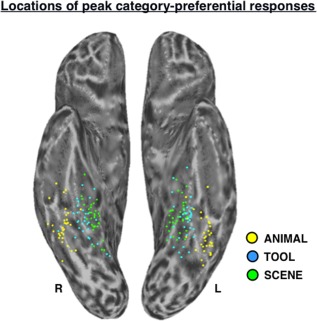
Figure 3.

Locations of peak category‐preferential responses in VOTC. Scatter plot depicts the locations of peak SCENE (green dots), TOOL (blue dots), and ANIMAL (yellow dots) activation in the functional localizer contrasts (Table 1) for all subjects (n = 33), displayed in standardized surface space on the semi‐inflated left and right ventral cortical surfaces. L, left; R, right.
