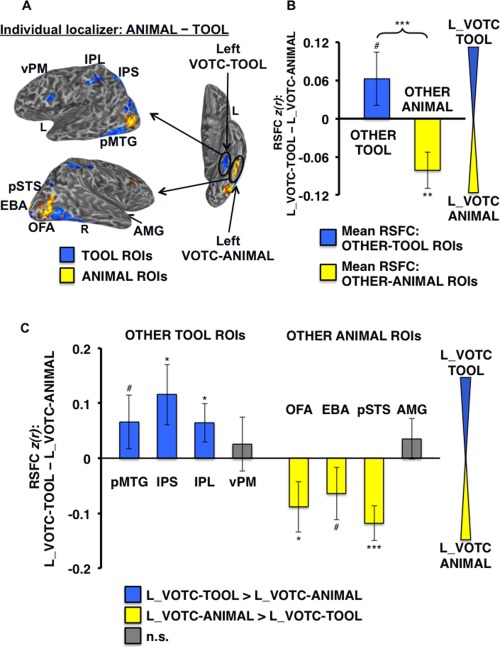
Figure 7.

Differential RSFC of left VOTC‐TOOL region and left VOTC‐ANIMAL region with OTHER‐TOOL versus OTHER‐ANIMAL ROIs. (A) Example individual localizer results displayed on semi‐inflated lateral (left) and ventral (right) cortical surfaces, as in Figure 4. Arrows depict the hypothesis that adjacent VOTC‐TOOL and VOTC‐ANIMAL regions within the left VOTC would show differentially stronger RSFC with OTHER‐TOOL versus OTHER‐ANIMAL regions, respectively, when localized at the individual‐level. Results of the within‐hemisphere analyses at both the category‐level (B) and individual ROI‐level (C) are strikingly similar to the parallel cross‐hemisphere comparisons (Fig. 5). ***P < 0.001; **P < 0.01; *P < 0.05; #P < 0.1; n.s., not significant All other plots and labels are the same as in Figure 5.
