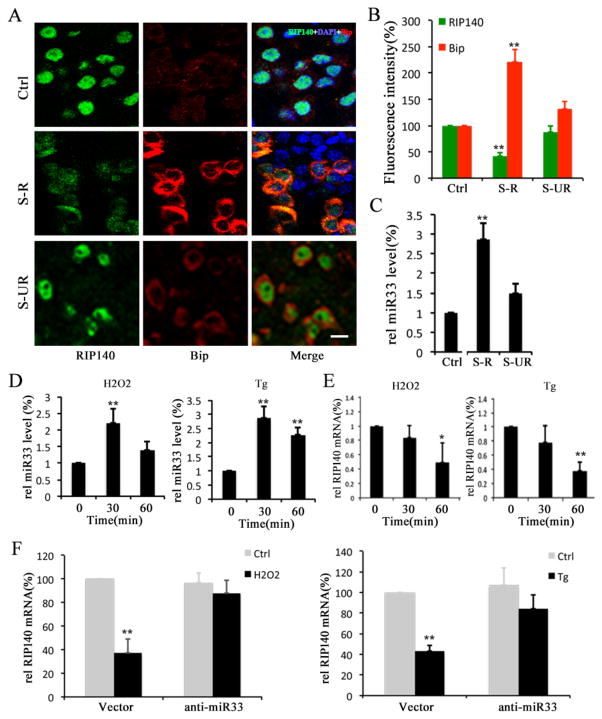
Figure 4. Activated microRNA33 (miR33) following behavioral stress contributes to a decrease in RIP140 level.
A, Confocal microscopy images showing RIP140 (Green) expression and ER stress marker Bip (Red) in hippocampi from normal control group (Ctrl), stress-responsive group (S-R) and stress unresponsive group (S-UR). Scale bar, 20 μm. B, Quantified results of fluorescence intensity showing RIP140 and Bip expression from 7 different fields of hippocampus. C, Expression level of miR33 in hippocampi of Ctrl, S-R and S-UR groups. D, Expression level of miR33 in astrocytes treated with oxidative stress inducer H2O2 and ER stress inducer thapsigargin (Tg). E, Expression level of RIP140 mRNA in astrocytes treated with H2O2 and Tg. F, Expression level of RIP140 mRNA in astrocytes, with or without miR33 knockdown, treated with H2O2 and Tg. The statistic results are presented as means ± SEM., (n=5–7), *p<0.05 and **p<0.01 compare to control group determined by one-way analysis of variance.

