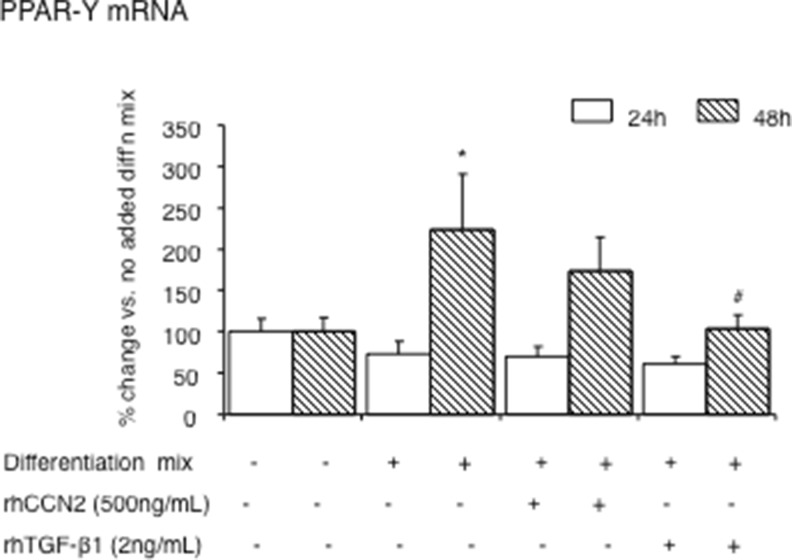
Fig. 3.
PPAR-γmRNA regulation by rhCCN2 or rhTGF-β1 each in the presence of differentiation mix. PPAR-γ mRNA levels in differentiated NIH/3T3L1 cells at 24 and 48 h are shown. Cells were treated with differentiation mix alone at time 0, in some cases with added rhCCN2 (500 ng/ml) or active rhTGF-β1 (2 ng/ml). Data are expressed as mean ± SD; *p < 0.05 vs no differentiation mix added at the same time point; #p < 0.05 vs differentiation mix alone at the same time point (by ANOVA)

