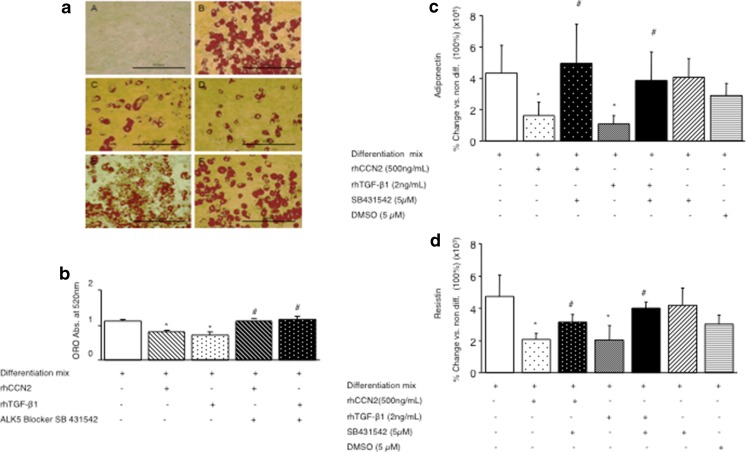
Fig. 5.
Regulation of fat cell differentiation markers by rhCCN2 or rhTGF-β1 each in the presence of differentiation mix and TGF-βreceptor blocker. (a) Representative images of Oil red O stained cells at day 0 in A, or 10 days post differentiation in B to F. Cells were treated with differentiation mix, in some cases with rhCCN2 (500 ng/ml), active rhTGF-β1 (2 ng/ml) and/or TGF-β receptor blocker SB431542 (5 μM) at day 0 as indicated, and were then cultured as described in the Methods; at day 10 cells were fixed with 10 % formalin and stained with Oil red O, then photographed. Each size-bar in (a) indicates 400 μM. In (b) Oil red O quantitative data investigating the effect of rhCCN2 (500 ng/ml), active rhTGF-β1 (2 ng/ml) and TGF-β receptor blocker SB431542 (5 μM) on adipocyte differentation are shown (b). Data are expressed as mean ± SD *p < 0.05 vs differentiation mix alone cells; #P < 0.05 each vs. the respective rhCCN2 or rhTGF-β1 treatment with differentiation mix (by ANOVA). Adiponectin (c) and Resistin (d) mRNA levels were determined at day 10. Data shown in (b) to (d) are generated from 3 independent experiments conducted in triplicate wells and are expressed as mean ± SD. DMSO was used as a vehicle control; *p < 0.05 each vs differentiation mix alone; #p < 0.05 vs added rhCCN2 or rhTGF-β1 each with differentiation mix (by ANOVA)

