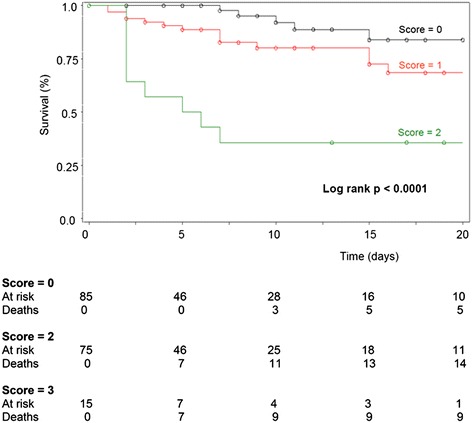
Figure 1.

Survival after ED presentation based on mottling and capillary lactates estimated using the Kaplan-Meier method. Kaplan-Meier survival curve of patients with clinical SIRS at emergency department presentation according to the nurse hypoperfusion score. Vertical axis represents estimated probability of survival. Horizontal axis represents time in days after emergency department admission. Censored observations, corresponding to patient survivors that were lost of follow-up, are represented by circles.
