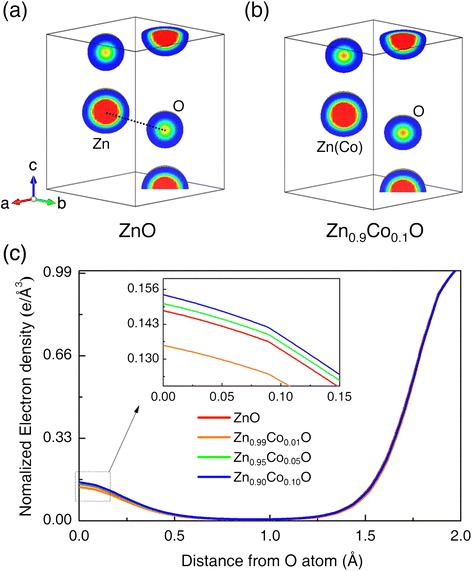
Figure 3.

Electron density distribution and line profiles. Electron density distribution of (a) ZnO and (b) Zn0.9Co0.1O on the (110) plane obtained from Rietveld/MEM analyses. (c) Electron density line profiles of the ZnO and ZnCoO samples along the O-Zn(Co) bond (indicated by the dotted line in (a)). The inset is a magnification of the line profiles around the O atoms.
