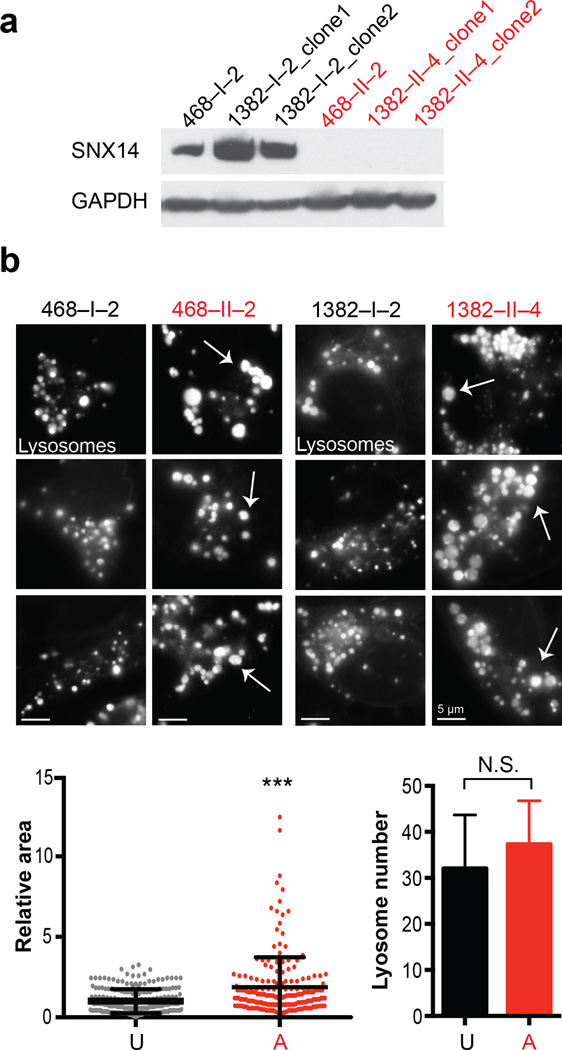
Figure 3. Patient-derived SNX14 mutant neural progenitor cells display enlarged lysosomes.
(a) Immunoblot of IPSC-derived neural progenitor cells (NPCs) from families 468 (p.Arg378*) and 1382 (p.Lys395Argfs*22), with affected (A, red) and unaffected (U, black) labeled. Affecteds showed undetectable SNX14 protein. GAPDH: loading control. (b) Lysotracker Green DND-26 staining with engorged lysosomes in affecteds NPCs (arrows). Scale bar 5 um. Dot plot shows relative area for individual LysoTracker positive lysosomes (n = 223 and 194 lysosomes from 2 families unaffected and affected NPCs respectively, N = 2). Graph bars represent average number of LysoTracker-positive lysosomes per cell (n = 17 and 18 from 2 families unaffected and affected NPCs respectively, N = 2). Error bars, S.D. *** p < 0.0005, N.S. not significant (two tiled t-test).

