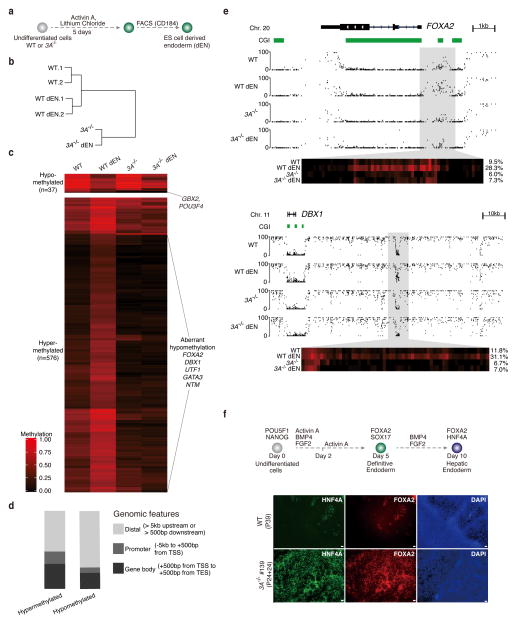
Figure 5. Effect of DNMT3A deletion on endoderm differentiation.
(a) Schematic for the generation of CD184+ endodermal progenitor cells (dEN).
(b) Global analysis for the WGBS data of undifferentiated and dEN cells from WT (P23 and P26) and DNMT3A−/− (P24+13). Hierarchical clustering based on mean DNA methylation levels of 1 kb tiles across the human genome using Euclidean distance. 1 and 2 are two biological replicates. The passage number of the replicates is within 2 passages.
(c) Heat map of methylation levels (black, 0; red, 1) in WT, WT dEN, DNMT3A−/−, and DNMT3A−/− dEN of DMRs that change methylation significantly (q-value < 0.05 and methylation difference of at least 0.2) between WT and WT dEN.
(d) Classification of endoderm DMRs into promoters, gene bodies and distal regions as defined in the legend.
(e) Genome browser tracks of 1kb and 10kb regions highlight global and local methylation level for FOXA2 and DBX1. The heat map below shows the DNA methylation values of individual CpGs within the highlighted region. The average DNA methylation value for the entire highlighted region is shown on the right.
(f) Hepatoblast differentiation of WT (P39) and DNMT3A−/− (P24+24) cells. Top: Schematic of hepatoblast differentiation. Bottom: Representative images from two individual biological replicates are shown. 4X magnification of hepatoblast markers FOXA2, HNF4A immunostaining images for HUES64 (WT), DNMT3A−/− (#139) are shown. Scale bars, 100μm.

