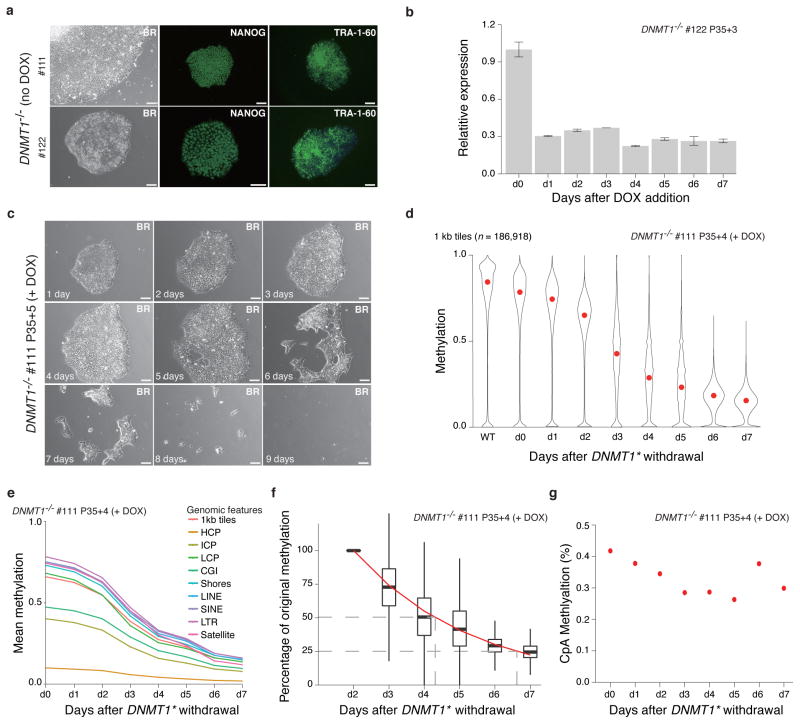
Figure 7. Loss of DNMT1 causes global demethylation and cell death.
(a) Representative bright field (BR) and NANOG/TRA-1-60 immunostaining for DNMT1−/− cells with the exogenous DNMT1* expressed (no DOX). 10X magnification. Scale bars, 100μm.
(b) RT-qPCR analysis after DNMT1* withdrawal relative to d0 level. Error bars are based on two replicates and represent one standard error.
(c) DNMT1* withdrawal causes massive cell death. Representative 10X magnification bright field (BR) images are shown. Scale bars: 100μm.
(d) Violin plots of the mean methylation (measured by RRBS) of 1 kb tiles across the human genome after DNMT1* withdrawal. Mean is indicated by red dot.
(e) Global reduction of DNA methylation in different genomic features. Overall CpGs (1kb tile) and selected features including CpG Islands (CGI), Shores, HCPs, ICPs, LCPs, LINEs, SINEs and satellite repeats are shown.
(f) Exponential model of methylation decay for 1kb tiles. Methylation at day 2 was normalized to 1 and methylation levels on subsequent days were calculated as a percentage of the day 2 value. An exponential model was fitted starting at day 2 and is shown by the red line. The dashed grey lines mark the timepoints when 50% and 25% of the day 2 methylation levels remain. Days 0 and 1 were excluded from this model to avoid noise from any remaining DNMT1 protein.
(g) Mean CpA methylation levels after DNMT1* withdrawal.

