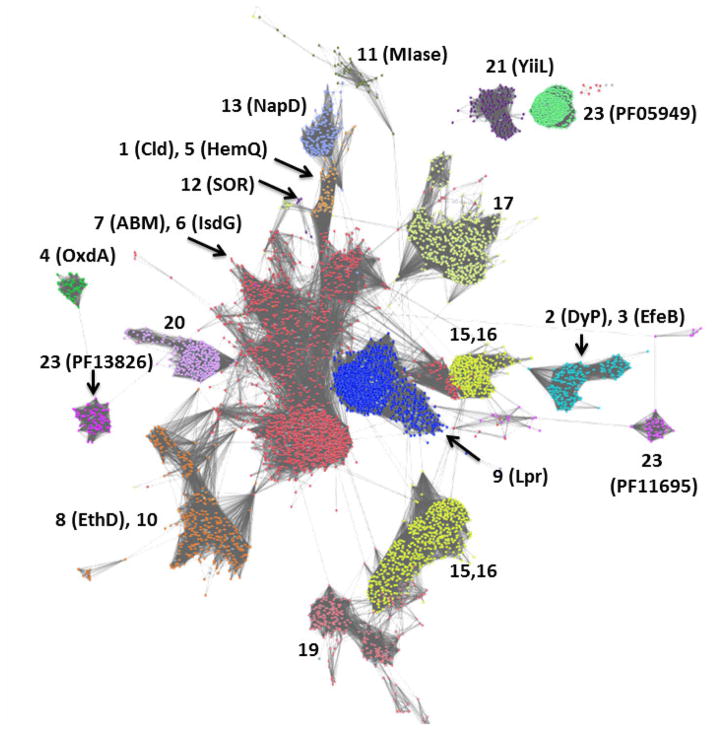
Figure 1. Network analysis of CDE superfamily (SCOP #54909, InterPro CL0032) showing its subdivision into families.
Groups of protein sequences with ≥50% pairwise identity are represented by individual dots colored according to Pfam family designation. Each family is labeled according to the number assigned to it in Table 1. Dots are shown overlapping or with lines connecting them if the least significant pairwise sequence-similarity score between the representative sequences of each is better than the threshold (BLAST E-value ≤1×10⁻⁷). The superfamily resolves into ≥18 families at this relatively low level of stringency, with at least one (group 7, the ABM family) beginning to resolve into subgroups. The network was generated from >100,000 sequences downloaded from Pfam and using the Enzyme Function Initiative Enzyme Similarity Tool (http://efi.igb.illinois.edu/efi-est/) and visualized using Cytoscape (www.cytoscape.org).

