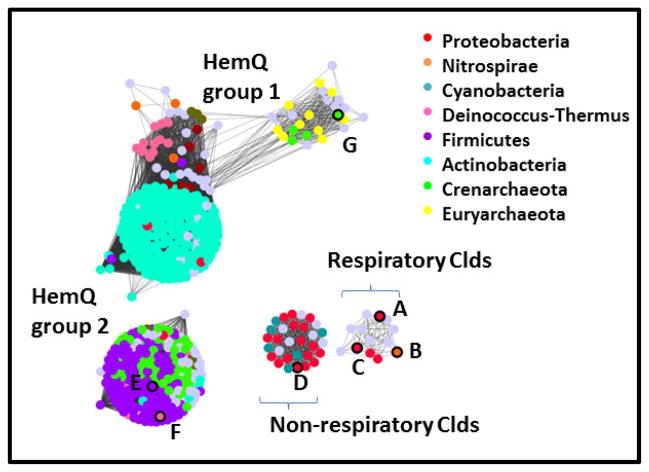
Figure 7. Network analysis of the Cld family (PF06778) showing its division into subfamilies.
Groups of protein sequences with ≥85% pairwise identity are represented by dots colored according to phylum domain of life of their host organism, as shown in the legends. Gray dots indicate that no assignment is presented. Proteins with crystal structures in the the Protein Data Bank are outlined in black on the left panel, and their PDB IDs given here: A. 2VXH; B. 3NN1; C. 3Q08; D. 3QPI; E. 1T0T; F. 1VDH; G. 3DTZ. See Table 2 for further information on these structures. Dots are shown overlapping or with lines connecting them if the least significant pairwise sequence-similarity score between the representative sequences of each is better than the threshold (BLAST E-value ≤1×10⁻²⁵). The Cld family forms 4 subgroups at this relatively high level of stringency, which are labeled here and discussed further in the text. The network was generated from 1117 sequences downloaded from Pfam and using the Enzyme Function Initiative Enzyme Similarity Tool (http://efi.igb.illinois.edu/efi-est/) and visualized using Cytoscape (www.cytoscape.org).

