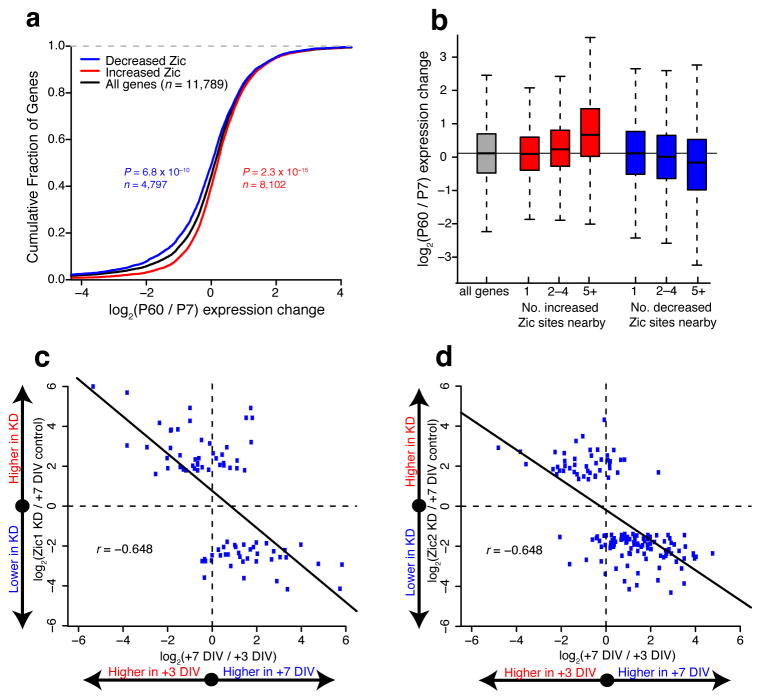
Figure 8. Zic1/2 promote the mature CGN transcriptional program.
(a) Relationship between Zic binding changes and nearby gene RNA-seq expression changes from P7 to P60. Significance of shifts assessed by two-sided Mann-Whitney U test. (b) Boxplots of gene expression change from P7 to P60 cerebellum binned by number of Zic binding sites associated with each gene. Having multiple Zic binding changes nearby more strongly associates with directional gene expression changes than single sites. (c,d) Relationship between cultured CGN development and Zic1 (c) or Zic2 (d) shRNA knockdown for genes marked significant in knockdown RNA-seq experiments (FDR < 0.10, n = 2 independent cultures). X-axis shows fold change in gene expression between +3DIV and +7DIV in cultured CGNs. Y-axis shows fold change in gene expression between control infected and Zic1 or Zic2 knockdown. Both knockdowns exhibit negative Pearson correlation coefficients (r).

