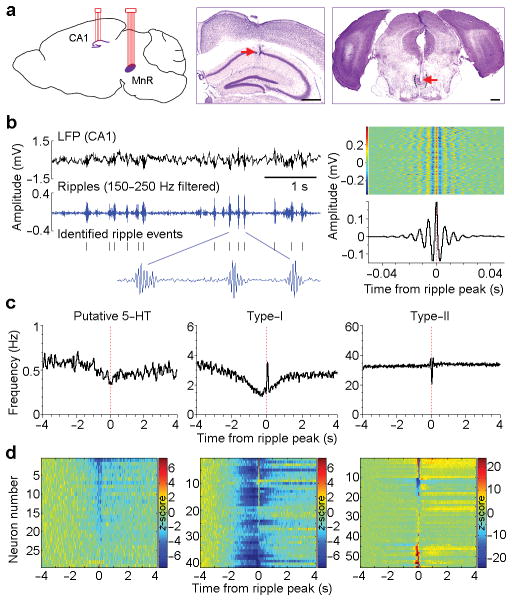
Figure 1. MnR neurons display hippocampal ripple correlated activity.
(a), Schematic drawing of the simultaneous recording sites in the hippocampal CA1 and MnR (left panel) and representative coronal sections showing recording sites in the CA1 and MnR (middle and right panels, respectively). Dotted outline indicates boundary. Scale bars, 0.5 mm. (b), Representative local field potential (LFP) and filtered ripple events recorded in the CA1 (left panel), and rasters and mean amplitude of 1000 ripple events (right). Colour bar represents voltage amplitude. (c), Representative activity of putative 5-HT (serotonin), type-I and type-II neurons plotted in relation to the ripple peak (time 0). The 3 neurons were recorded simultaneously. (d), Summary of all the classified MnR neurons (recorded from 6 mice) identified as either putative 5-HT (15%, 29/191; left panel), type-I (21%, 41/191; middle panel) or type-II (29%, 55/191; right panel). Colour bars represent z-scored neural firing frequency.

