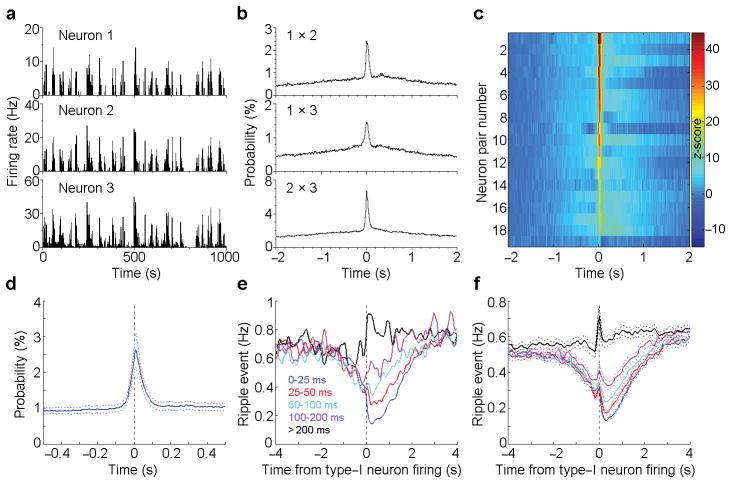
Figure 3. Ripple event frequency in relation to type-I neuron firing-synchrony.
(a), Rate histograms of 3 simultaneously recorded type-I MnR neurons during sleep. (b), Cross-correlation histograms between neurons 1 & 2, 1 & 3 and 2 & 3 (the same 3 neurons as shown in a). (c), Summary of the cross-correlations for all the recorded type-I neural pairs (n = 19 pairs). Colour bar represents z-scored correlation probability. (d), Averaged cross-correlation histogram of the simultaneously recorded type-I neuron pairs (the same 19 pairs as shown in c). (e,f), Ripple event frequency in relation to type-I neuron synchrony window: an example of a neuron (e) and mean ± s.e.m. of 26 neurons (f). Co-firing interval was determined between two neurons by examining each spike of a type-I neuron with respect to the closest spike of another type-I neurons, and was classified into one of 5 windows: 0–25, 25–50, 50–100, 100–200, >200 ms. Type-I neurons with mean firing-frequency above 1 Hz were used for analyses.

