Fig 2.
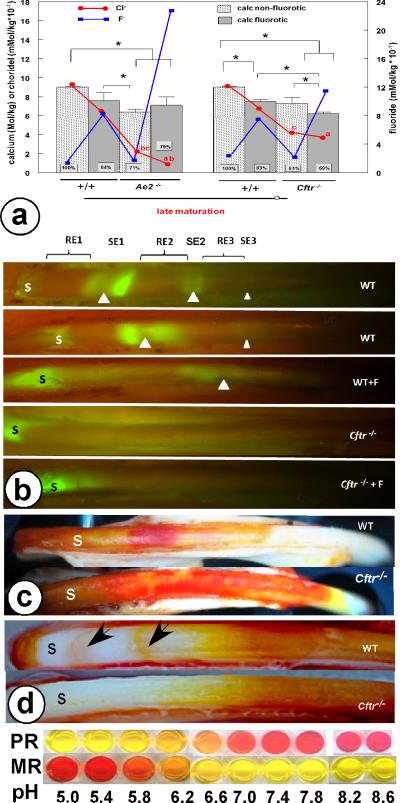
Disruption of Cftr and exposure to fluoride reduces calcium and chloride content in maturation enamel (Fig. 2a), changes ameloblast modulation (Fig. 2b) and acidifies forming enamel (Fig 2c,d).
Fig 2a. Quantitative microprobe (means and SD, n=3-7). Left Y-axis: calcium (bars, * statistically significant differences) and chloride (red lines), right Y-axis: fluoride (blue lines). For the sake of clarity the standard deviations for chloride and fluoride graphs were not drawn (see table 1 and reference 11); chloride values marked by the same character are significantly different. The Ae2a,b-null data from reference 11.
Fig. 2b. Calcein labeling in non-fluorotic and fluorotic mandibular incisor enamel of wild-type (WT) and Cftr-null mice. S secretory stage. White arrow heads indicate center of smooth-ended (SE) zone between two wide bands of ruffle-ended (RE) cells. Each SE-zone is marked by an apical and incisal fluorescent label indicating the sites where the ameloblast layer is briefly leaky for calcein during change of position of tight junctions. In WT enamel the most incisal third band is extremely weak. Fig. 2c Mandibular incisor enamel of wild-type and Cftr-null mutant stained with methyl red (MR). Fig 2d: Wild-type (WT) and Cftr-null maxillary incisor stained with phenol-red (PR) revealing two neutral (light pink) SE bands.

