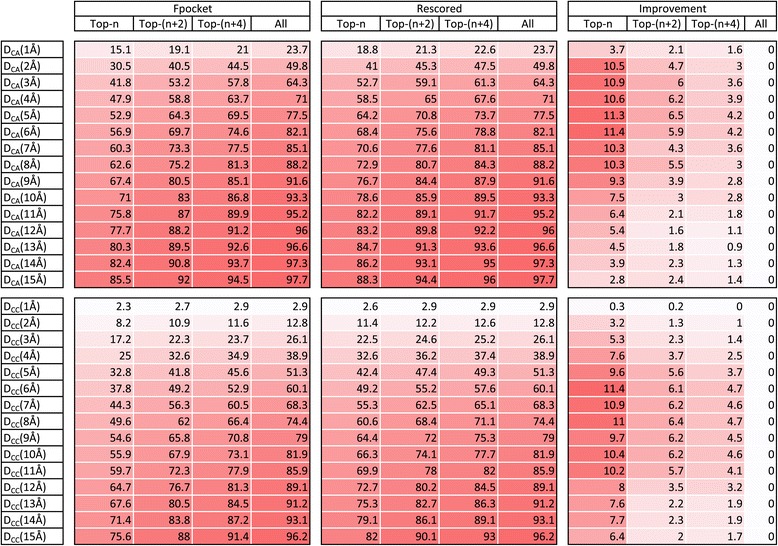
Figure 4.

Detailed results. Table and heatmap showing success rates [%] of Fpocket predictions for original and rescored output list of pockets together with the nominal improvements made by PRANK rescoring algorithm on CHEN11 dataset (measured by DCA and DCC criteria for different integer cutoff distances). For the DCA criterion the biggest improvements were achieved around the meaningful 4-6 Å cutoff distances. Displayed results are averaged numbers from ten independent 5-fold cross-validation runs. Four columns in each group show success rates calculated considering progressively more predicted pockets ranked at the top (where n is the number of known ligand-binding sites of the protein that includes evaluated binding site). For protein with just one binding site they correspond to Top-1, Top-3 and Top-5 cutoffs that were commonly used to report results in previous ligand-binding site prediction studies.
